<?xml version="1.0" encoding="utf-8"?><feed xmlns="http://www.w3.org/2005/Atom" ><generator uri="https://jekyllrb.com/" version="3.10.0">Jekyll</generator><link href="https://leobip.github.io/feed.xml" rel="self" type="application/atom+xml" /><link href="https://leobip.github.io/" rel="alternate" type="text/html" /><updated>2026-07-11T09:12:03+02:00</updated><id>https://leobip.github.io/feed.xml</id><title type="html">Leoncio López — Software DevOps &amp;amp; Automation Engineer</title><subtitle>A digital journey into my professional career &amp; projects</subtitle><author><name>Leoncio López</name><email>leobip27@gmail.com</email></author><entry><title type="html">Building StreamTrack: A Full-Stack Mobile App for Tracking What You Watch</title><link href="https://leobip.github.io/mobile/flutter/python/building-streamtrack/" rel="alternate" type="text/html" title="Building StreamTrack: A Full-Stack Mobile App for Tracking What You Watch" /><published>2026-06-15T09:00:00+02:00</published><updated>2026-06-15T09:00:00+02:00</updated><id>https://leobip.github.io/mobile/flutter/python/building-streamtrack</id><content type="html" xml:base="https://leobip.github.io/mobile/flutter/python/building-streamtrack/"><![CDATA[<p>Keeping track of what you’re watching across five different streaming services
is surprisingly hard. You start a series on Netflix, continue it on a different
device, forget what episode you were on, and end up rewatching fifteen minutes
you’ve already seen.</p>

<p>But there’s another problem I run into constantly: someone recommends a series,
or I stumble across something interesting in an article, a trailer, or an ad —
and the first question is always <em>“where do I actually watch this?”</em> I Google it,
and every result assumes I’m in the US. Netflix US, Hulu, HBO Max, Peacock — none
of which help me if I’m in Europe. The thing is, streaming catalogues aren’t
global. A series that’s on Netflix in the US might be on HBO in Spain, on Amazon
in Germany, or simply unavailable where you are until a completely different date.
Sometimes it’s not even on streaming — it’s on a cable channel or a regional
service you’d never think to check.</p>

<p>I wanted a single place — my place — to solve both problems: know what I’m
watching and where I left off, and instantly see where something is available
<em>in my country</em>, on <em>my services</em>. So I built one.</p>

<p>This is <strong>StreamTrack</strong>: a full-stack mobile app built with Flutter, FastAPI,
Supabase, and Google Cloud Run, currently in its <strong>first beta test</strong>.</p>

<blockquote>
  <p>⚠️ <strong>This project is actively under development.</strong> Everything described here
represents the current state of the first beta. Features, architecture, and
decisions are evolving. This article will be updated as the app grows.</p>
</blockquote>

<hr />

<h2 id="what-streamtrack-does">What StreamTrack Does</h2>

<p>StreamTrack lets you:</p>

<ul>
  <li><strong>Search</strong> series and movies (powered by TMDB + OMDB)</li>
  <li><strong>Track your progress</strong> per season and episode</li>
  <li><strong>Know what’s next</strong> — always see the next episode you haven’t watched</li>
  <li><strong>See where to watch</strong> — streaming availability by country (Netflix, HBO, Disney+…)</li>
  <li><strong>Configure your platforms</strong> — the app highlights what’s available on <em>your</em> services</li>
  <li><strong>Get daily updates</strong> — new episodes, season premieres, status changes for everything in your list</li>
  <li><strong>Rate</strong> series and individual episodes (1–5 stars)</li>
  <li><strong>Share</strong> — send a series card (name, ratings, synopsis, where to watch) to anyone</li>
</ul>

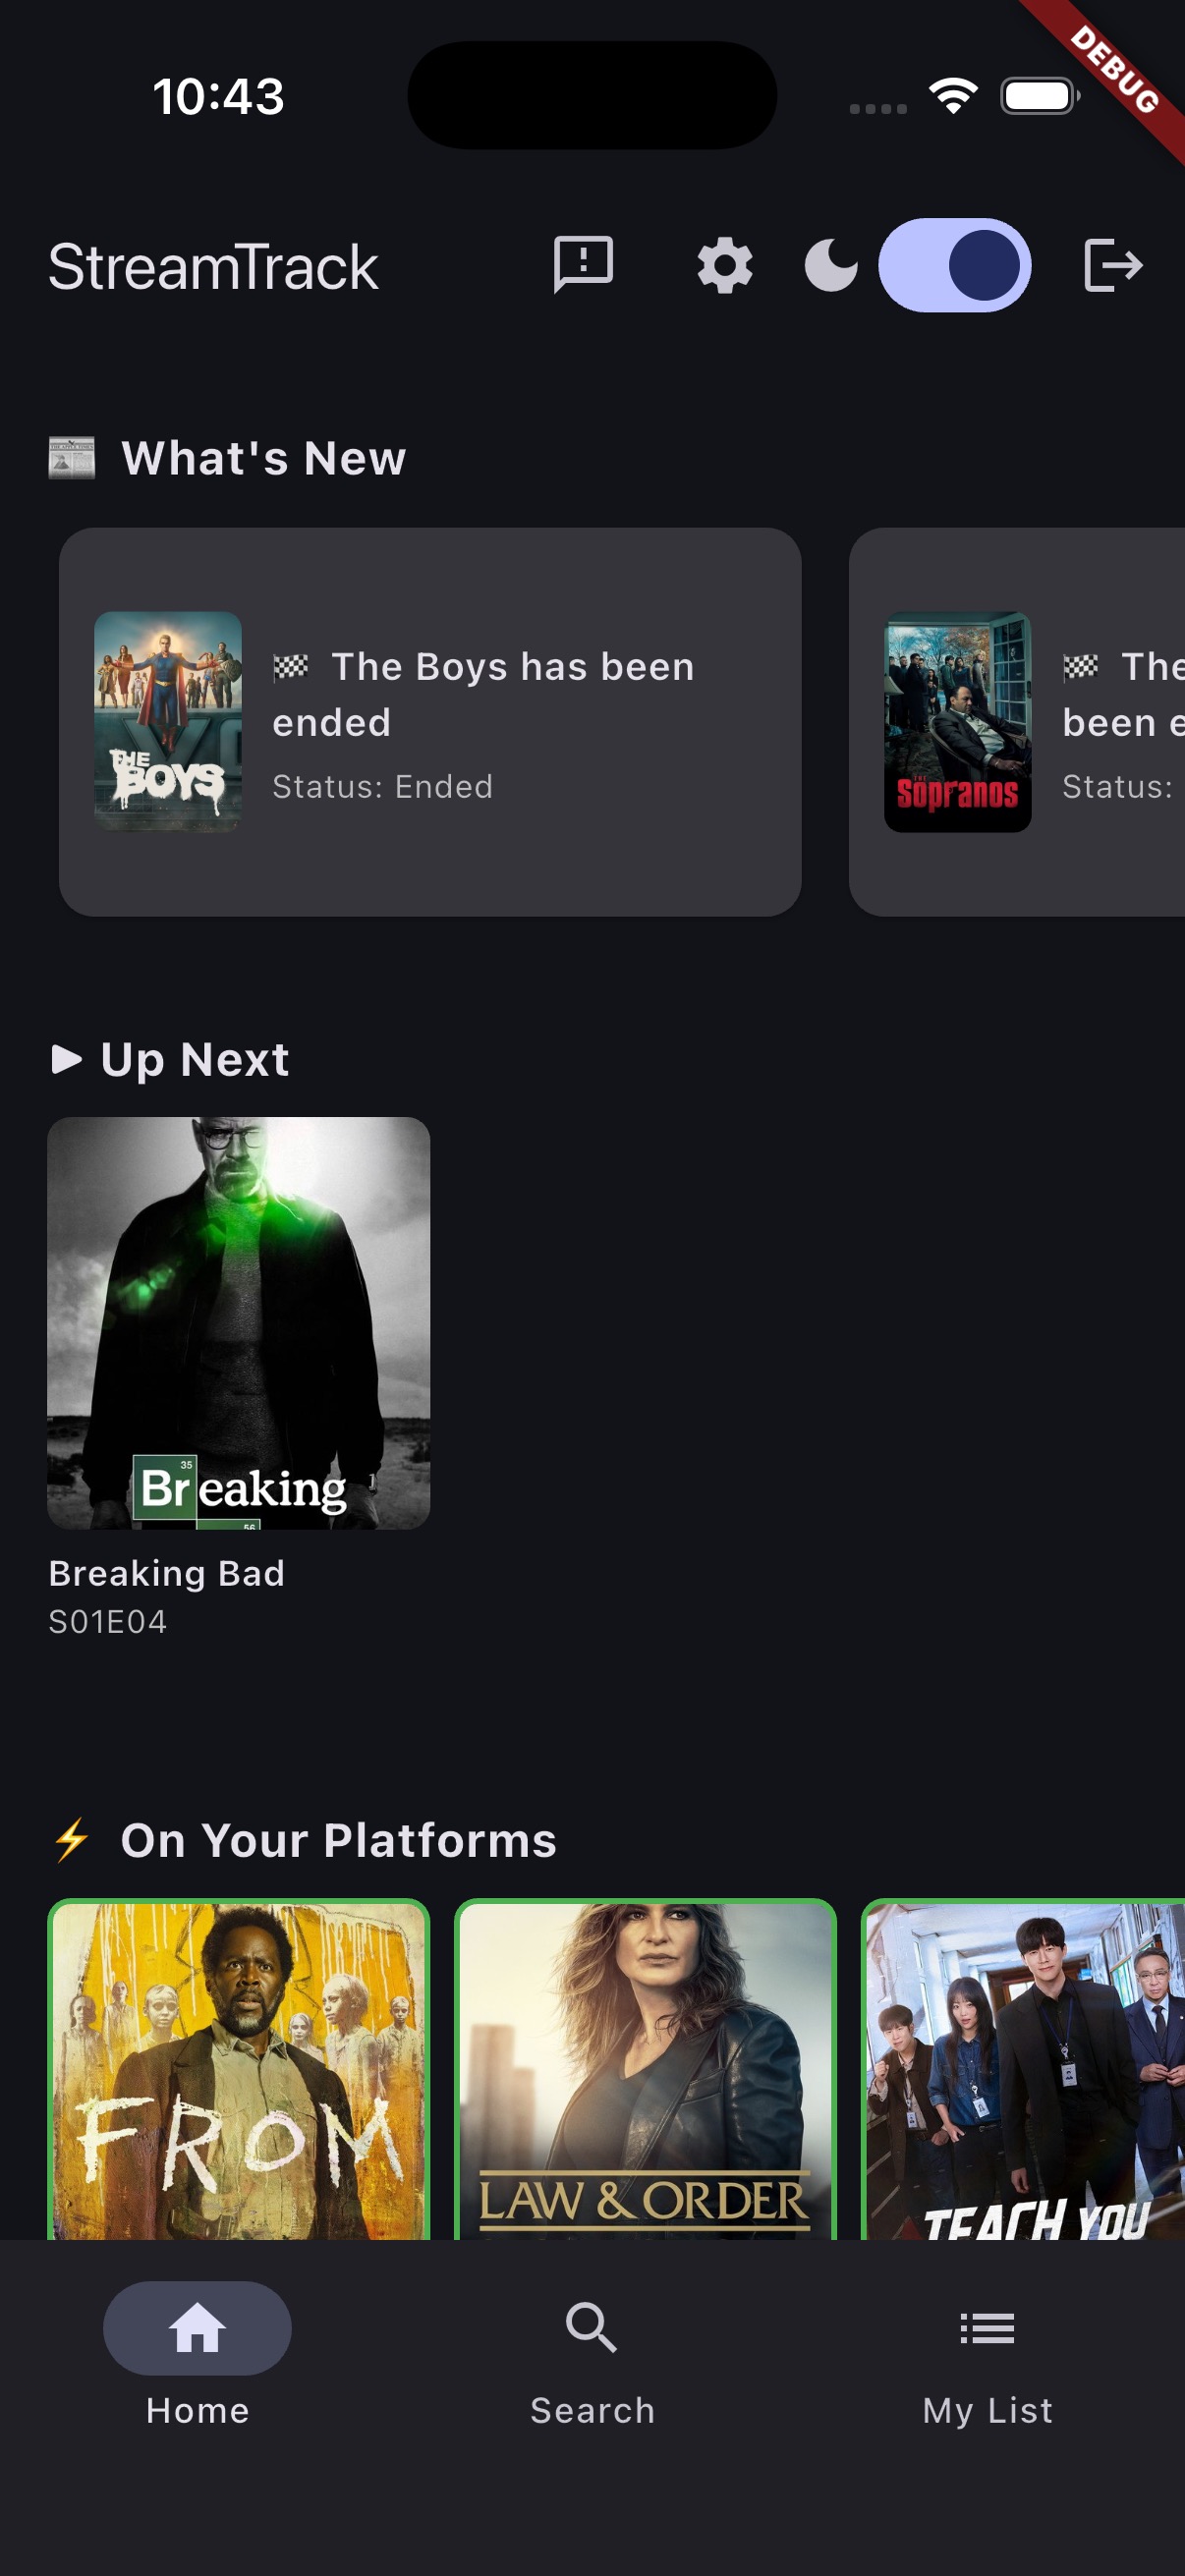
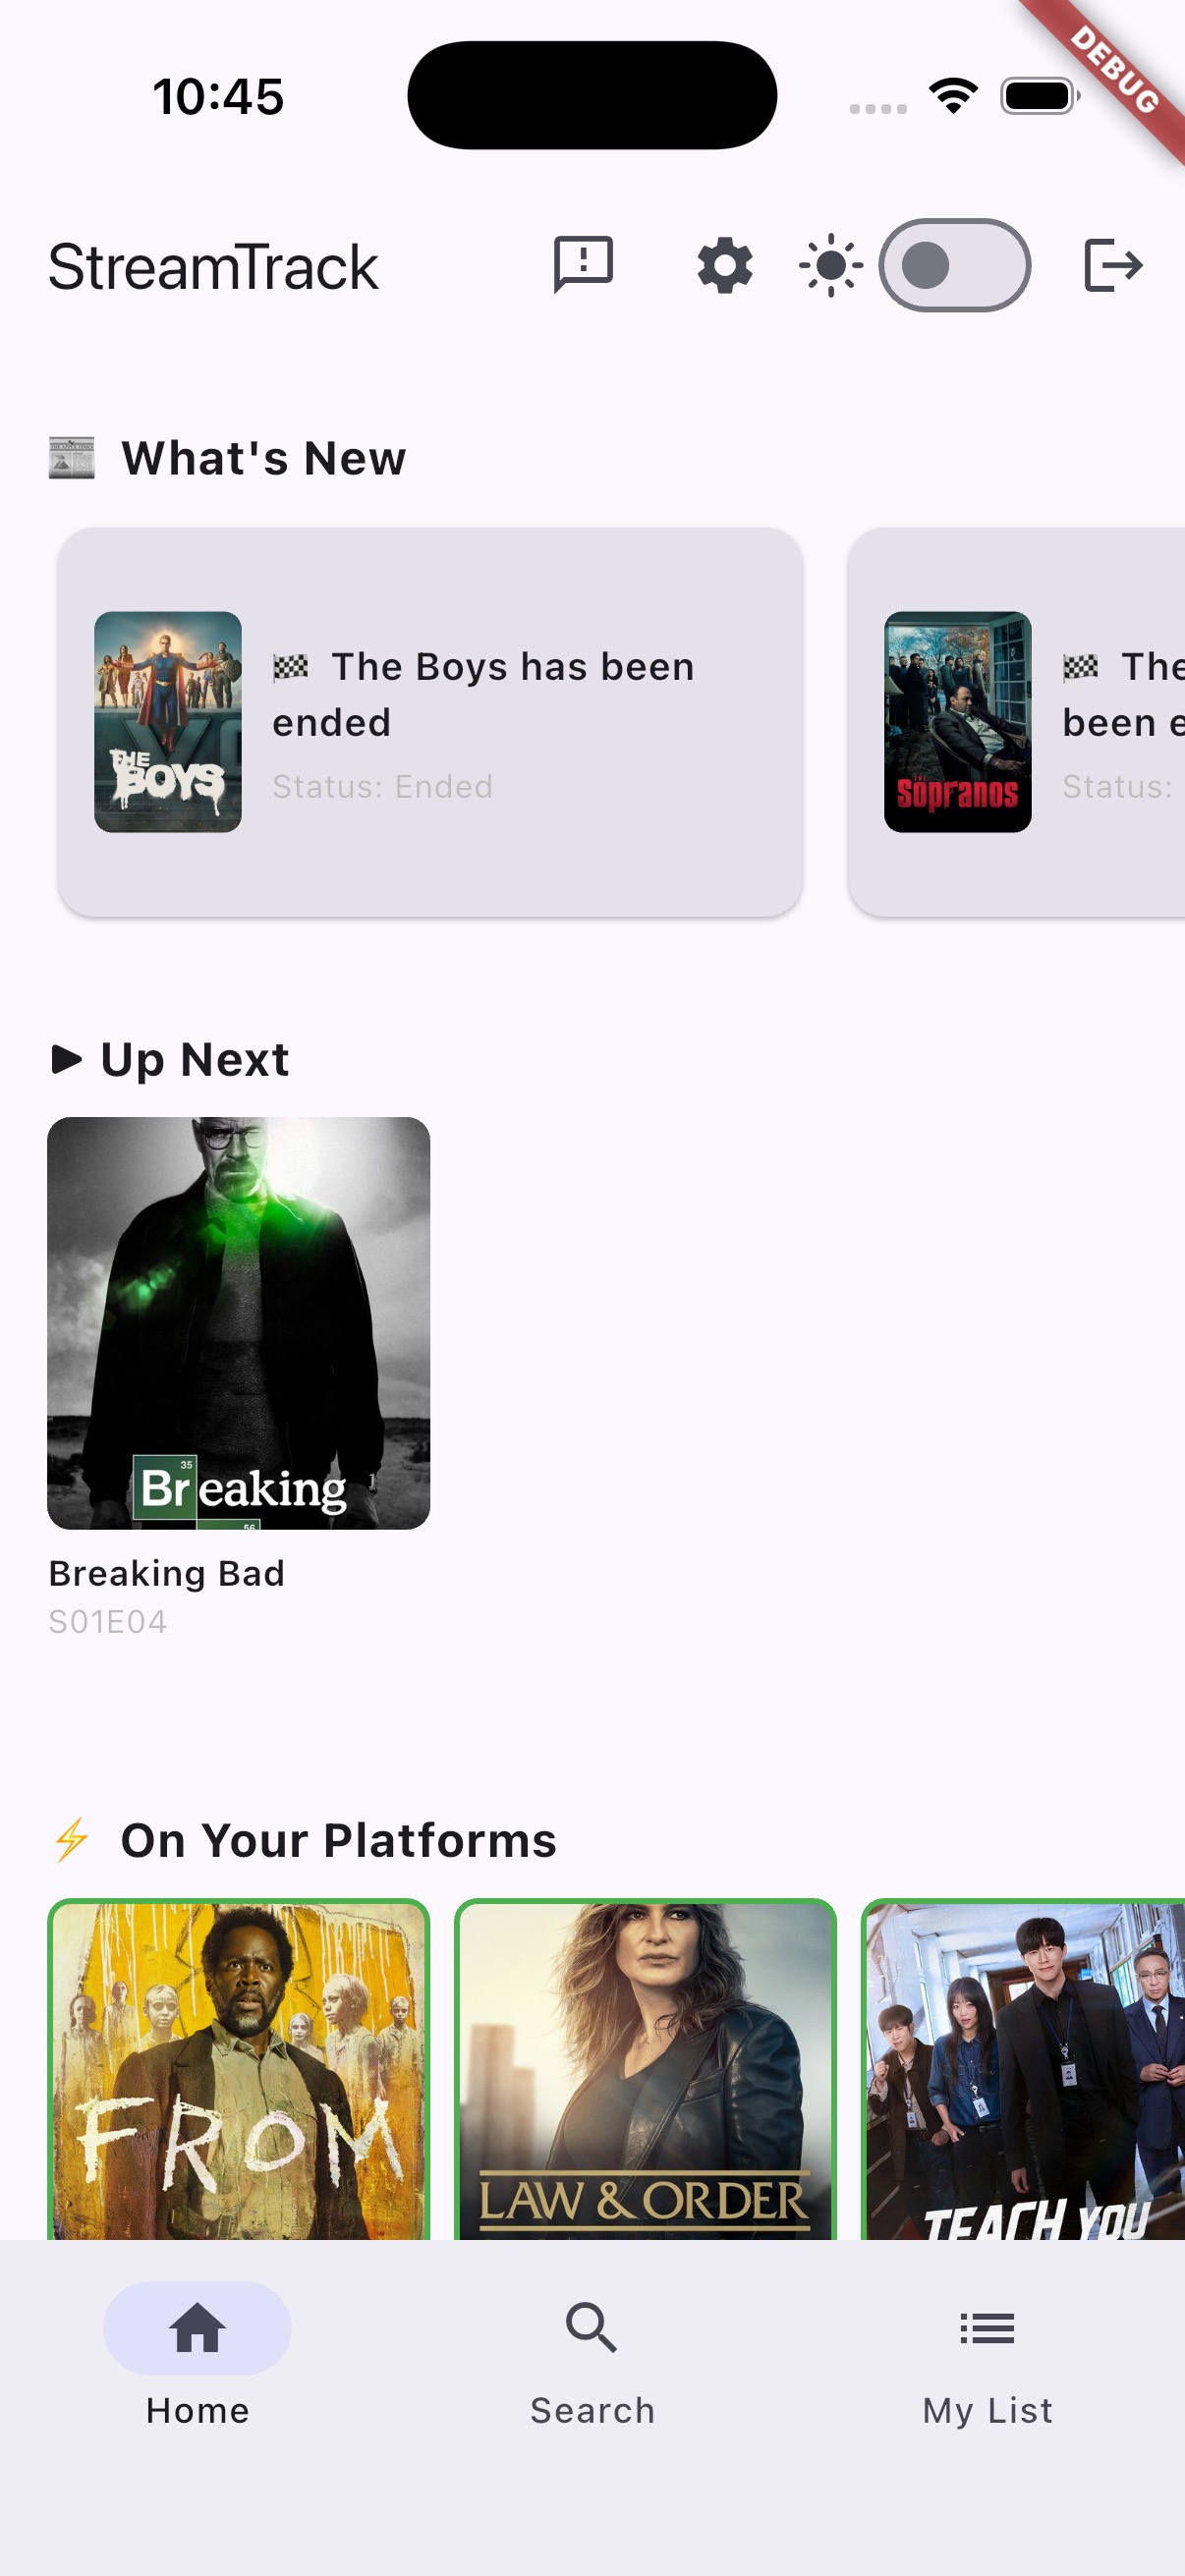
<figure style="display: flex; flex-direction: column; align-items: center;">
  <img src="/assets/images/2026-06-15-streamtrack-home.jpg" style="max-width:35%; height:auto; border-radius: 12px;" />
  <figcaption style="margin-top: 0.5em; font-style: italic;">
    Home screen — What's New, Up Next, On Your Platforms, Trending
  </figcaption>
</figure>

<hr />

<h2 id="why-build-it-instead-of-using-an-existing-app">Why Build It Instead of Using an Existing App?</h2>

<p>Mainly because I wanted to. But also:</p>

<ul>
  <li>Existing trackers are either too social (Letterboxd, Trakt) or too bloated</li>
  <li>Streaming availability data is rarely accurate or region-aware</li>
  <li>I wanted to experiment with a full-stack mobile architecture end-to-end —
from API design to mobile deployment</li>
  <li>It’s a great playground for decisions I make daily at work (auth, cloud hosting,
data modeling) but applied to something personal</li>
</ul>

<hr />

<h2 id="tech-stack">Tech Stack</h2>

<table>
  <thead>
    <tr>
      <th>Layer</th>
      <th>Technology</th>
      <th>Why</th>
    </tr>
  </thead>
  <tbody>
    <tr>
      <td><strong>Mobile</strong></td>
      <td>Flutter (iOS + Android)</td>
      <td>Single codebase, strong performance, dark theme out of the box</td>
    </tr>
    <tr>
      <td><strong>Backend</strong></td>
      <td>Python + FastAPI</td>
      <td>Async, fast to prototype, Swagger auto-generated, familiar</td>
    </tr>
    <tr>
      <td><strong>Auth</strong></td>
      <td>Supabase Auth (JWT/ES256)</td>
      <td>Free tier, 50K MAU, integrates cleanly with PostgreSQL</td>
    </tr>
    <tr>
      <td><strong>Database</strong></td>
      <td>Supabase PostgreSQL</td>
      <td>Relational, SQL-native, no vendor lock-in, $0 to start</td>
    </tr>
    <tr>
      <td><strong>Hosting</strong></td>
      <td>Google Cloud Run</td>
      <td>2M req/month free, scales to zero, no cold start problem</td>
    </tr>
    <tr>
      <td><strong>Data</strong></td>
      <td>TMDB API + OMDB API</td>
      <td>TMDB for everything; OMDB to enrich with IMDB/RT/Metacritic</td>
    </tr>
  </tbody>
</table>

<hr />

<h2 id="architecture">Architecture</h2>

<p>The architecture follows a clean separation between the mobile client and the
backend API. The app never talks to TMDB or Supabase directly from the device —
everything goes through the FastAPI backend. This keeps API keys off the device
and centralizes cache and business logic.</p>

<div class="language-plaintext highlighter-rouge"><div class="highlight"><pre class="highlight"><code>┌──────────┐     ┌──────────────┐     ┌─────────────────┐     ┌──────────┐
│  Flutter │────▶│ Supabase     │     │ Google Cloud Run│────▶│ TMDB     │
│  App     │     │  Auth (JWT)  │     │ (FastAPI)       │────▶│ OMDB     │
│  iOS/and │     └──────────────┘     │  $0 free tier   │     └──────────┘
│          │──── Bearer token ──────▶│                 │
│          │◀──── JSON data ─────────│                 │
│ SQLite   │                          └────────┬────────┘
│ (cache)  │                                   │
└──────────┘                          ┌────────┴──────────┐
                                       │ Supabase PostgreSQL│
                                       │ (user data, lists) │
                                       └───────────────────┘
</code></pre></div></div>

<p><strong>Why a backend instead of going BaaS-direct?</strong></p>

<p>It’s tempting to have the Flutter app talk directly to Supabase. It’s simpler
to set up. But it means putting your TMDB/OMDB API keys inside the app bundle —
where anyone can extract them. Beyond security, a backend also means:</p>

<ul>
  <li><strong>Shared cache</strong> — one TTL-based in-memory cache for all users instead of each
device hammering TMDB independently</li>
  <li><strong>Updatable logic</strong> — fix a bug or add a feature without pushing a new app version</li>
  <li><strong>Controlled rate limiting</strong> — OMDB allows 1,000 req/day free; with a backend
that’s easily manageable</li>
</ul>

<hr />

<h2 id="key-decisions">Key Decisions</h2>

<h3 id="supabase-over-firebase">Supabase over Firebase</h3>

<p>Firebase was the obvious first choice. But once I looked at the data model —
series, seasons, episodes, watched episodes, user ratings, per-user platform config
— it’s fundamentally relational. Firestore’s document model fights you at every join.</p>

<p>Supabase gives me PostgreSQL (real SQL, real foreign keys, real joins) with auth
and a decent free tier. Same 50K MAU gratis. Same Google OAuth and Apple Sign In
support. And the auth integrates with the database via Row Level Security. It was
the right fit.</p>

<table>
  <thead>
    <tr>
      <th> </th>
      <th>Firebase Firestore</th>
      <th>Supabase PostgreSQL</th>
    </tr>
  </thead>
  <tbody>
    <tr>
      <td>Data model</td>
      <td>Documents / collections</td>
      <td><strong>Relational SQL</strong></td>
    </tr>
    <tr>
      <td>For series/episodes/users</td>
      <td>⚠️ Awkward (relational data)</td>
      <td>✅ Natural (JOINs, FK)</td>
    </tr>
    <tr>
      <td>Vendor lock-in</td>
      <td>❌ Google proprietary</td>
      <td>✅ Standard PostgreSQL</td>
    </tr>
    <tr>
      <td>Cost at scale</td>
      <td>Unpredictable (pay-per-read)</td>
      <td>Predictable ($25/month fixed)</td>
    </tr>
  </tbody>
</table>

<h3 id="cloud-run-over-railwayrender">Cloud Run over Railway/Render</h3>

<table>
  <thead>
    <tr>
      <th> </th>
      <th>Render Free</th>
      <th>Railway</th>
      <th>Cloud Run</th>
    </tr>
  </thead>
  <tbody>
    <tr>
      <td>Cold start</td>
      <td>⚠️ 30–60s</td>
      <td>None</td>
      <td>~2s</td>
    </tr>
    <tr>
      <td>Free tier</td>
      <td>750h/month</td>
      <td>$5/month minimum</td>
      <td><strong>2M req/month</strong></td>
    </tr>
    <tr>
      <td>Auto-scale</td>
      <td>No</td>
      <td>No</td>
      <td><strong>Yes</strong></td>
    </tr>
    <tr>
      <td>Pay model</td>
      <td>Fixed</td>
      <td>Fixed</td>
      <td>Pay per use</td>
    </tr>
  </tbody>
</table>

<p>A 30-second cold start on Render Free is a deal-breaker for a mobile API. Cloud
Run scales to zero (costs nothing when idle) and wakes in ~2 seconds. The free
tier covers the entire beta phase comfortably.</p>

<h3 id="flutter-over-react-native">Flutter over React Native</h3>

<p>I had prior experience with Flet (Python’s Flutter wrapper), so the widget model
wasn’t completely new. Flutter’s dark theme support is first-class, the animation
primitives are clean, and the hot reload cycle is fast. A single codebase runs
natively on both iOS and Android with no compromise on performance.</p>

<hr />

<h2 id="backend-design">Backend Design</h2>

<p>The FastAPI backend exposes a clean REST API with Swagger UI at <code class="language-plaintext highlighter-rouge">/docs</code>. A few
design choices worth noting:</p>

<p><strong>TTL Cache in memory</strong> — TMDB search results are cached for 15 minutes, series
detail for 1 hour, streaming availability for 6 hours. This keeps API calls minimal
without needing Redis or any external cache layer.</p>

<p><strong>Multi-language and multi-country</strong> — every endpoint accepts <code class="language-plaintext highlighter-rouge">lang</code> and <code class="language-plaintext highlighter-rouge">country</code>
params. The same API serves a user in Spain (Netflix ES catalogue) and a user in
Germany (Netflix DE catalogue) without any code changes.</p>

<p><strong>Upcoming episodes</strong> — <code class="language-plaintext highlighter-rouge">/api/me/upcoming</code> tells you exactly what episode you
should watch next in every series you’re currently following. It’s the feature I
use most.</p>

<div class="language-plaintext highlighter-rouge"><div class="highlight"><pre class="highlight"><code>GET  /api/me/upcoming              → Next episodes for "watching" series
GET  /api/me/whats-new             → New episodes / season premieres in my list
GET  /api/trending/my-platforms    → Trending filtered by the user's services
GET  /api/series/{id}/similar      → "You might also like" recommendations
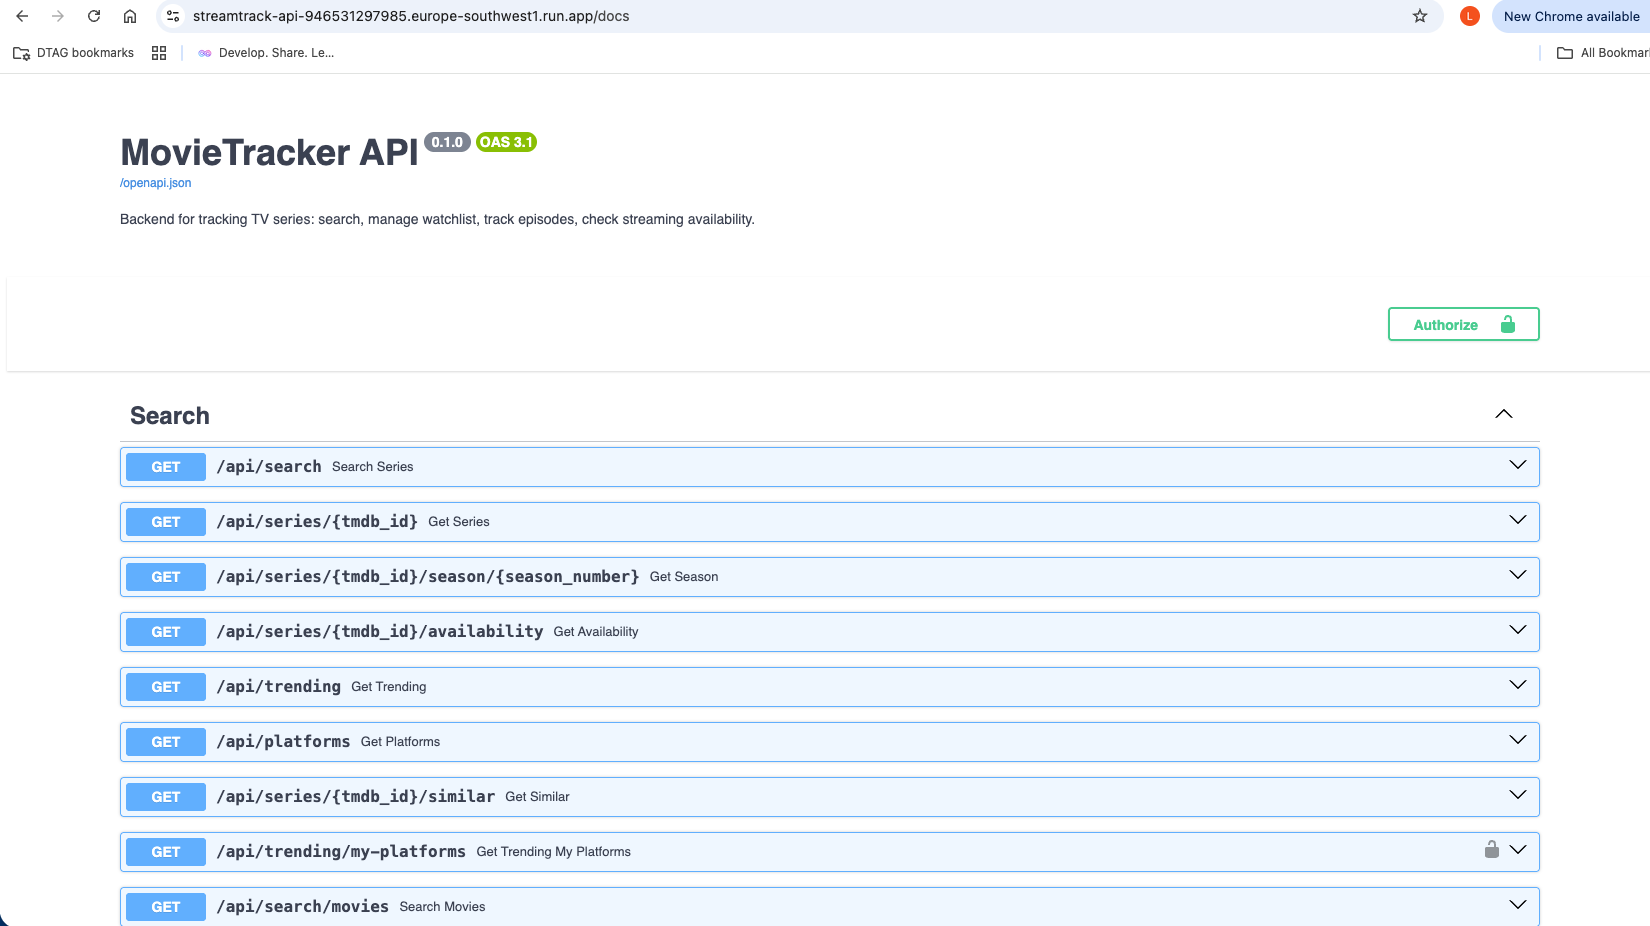
</code></pre></div></div>

<figure style="display: flex; flex-direction: column; align-items: center;">
  <img src="/assets/images/2026-06-15-streamtrack-swagger.png" style="max-width:100%; height:auto; border-radius: 8px;" />
  <figcaption style="margin-top: 0.5em; font-style: italic;">
    Swagger UI — full API endpoint list auto-generated by FastAPI
  </figcaption>
</figure>

<hr />

<h2 id="the-flutter-app">The Flutter App</h2>

<p>The app has three main tabs: <strong>Home</strong>, <strong>Search</strong>, and <strong>My List</strong>. A <strong>Settings</strong>
screen lets you configure your preferred streaming platforms — once set, the app
highlights available content everywhere.</p>

<h3 id="home">Home</h3>

<p>Four sections load on startup: <em>What’s New</em> (updates from your list), <em>Up Next</em>
(your immediate watchlist), <em>On Your Platforms</em> (trending content on your services),
and <em>Trending</em> (global top 20 for the week). All sections use shimmer skeletons
while loading — no blank screens.</p>

<h3 id="search">Search</h3>

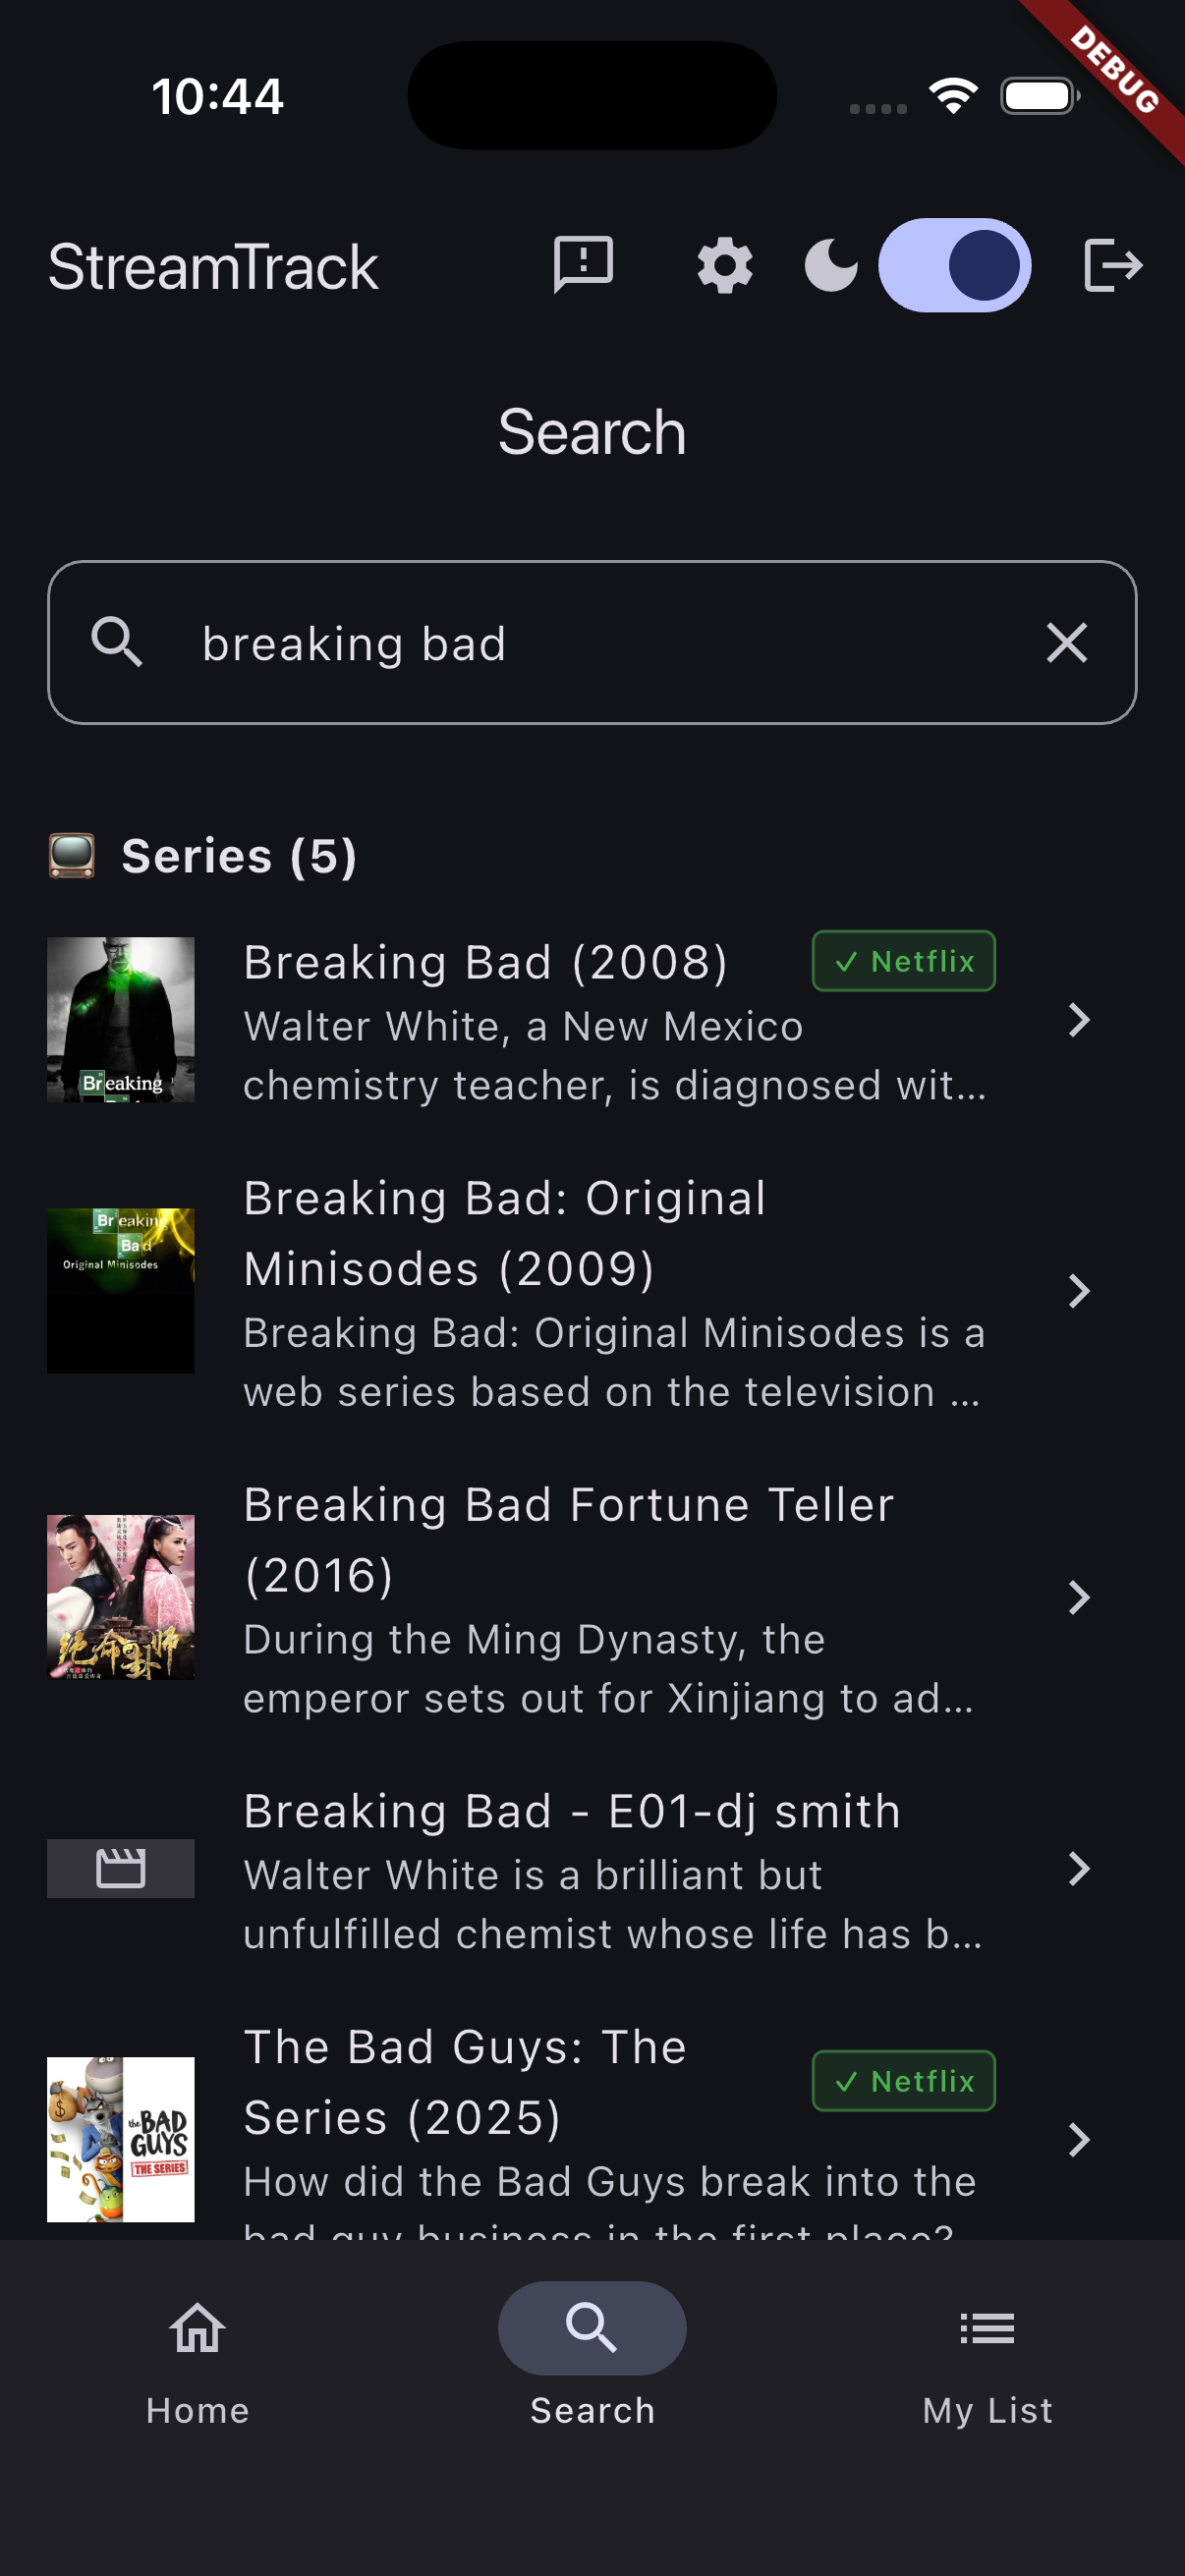
<p>A single search box returns series and movies in separate sections. Results badge
in green if the title is available on one of your configured platforms — the check
happens lazily in background, so the UI isn’t blocked.</p>

<figure style="display: flex; flex-direction: column; align-items: center;">
  <img src="/assets/images/2026-06-15-streamtrack-search.png" style="max-width:35%; height:auto; border-radius: 12px;" />
  <figcaption style="margin-top: 0.5em; font-style: italic;">
    Search results — series and movies in separate sections, green badges for titles
    available on your platforms
  </figcaption>
</figure>

<h3 id="series-detail">Series Detail</h3>

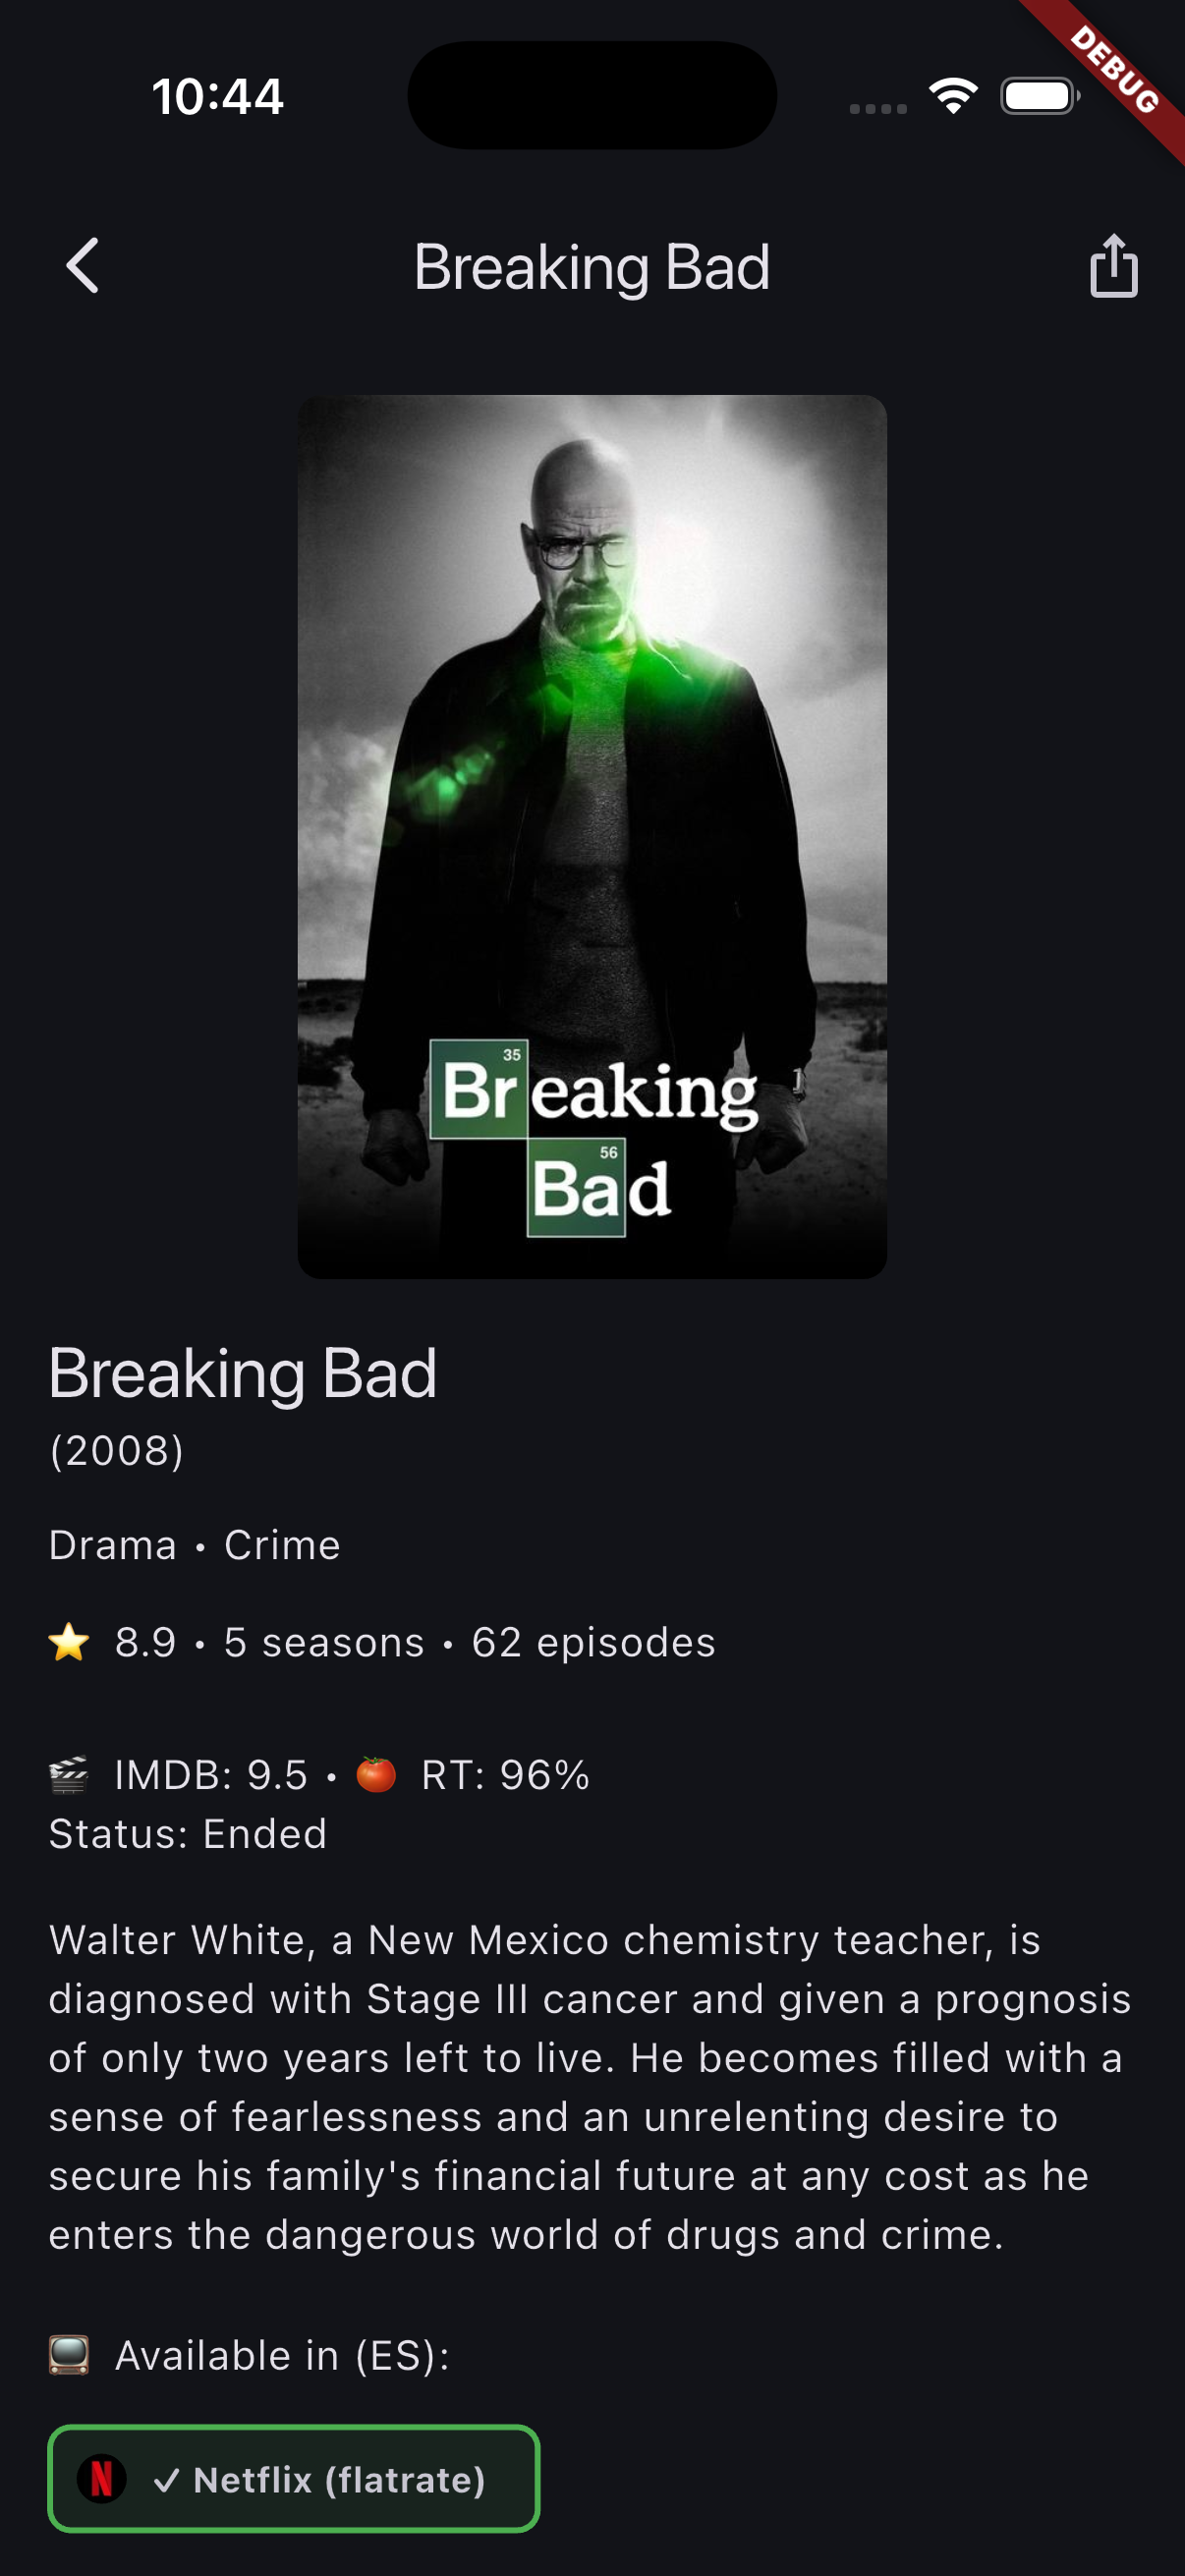
<p>The detail screen shows poster, all three ratings (TMDB / IMDB / Rotten Tomatoes),
synopsis, streaming availability chips with platform logos, a <em>“You might also like”</em>
horizontal scroll, and the full season and episode breakdown. Episodes are
interactive — tap to expand synopsis, checkbox to mark as watched. The status banner
at the top shows your current progress and lets you change platform or status in
one tap.</p>

<figure style="display: flex; flex-direction: column; align-items: center;">
  <img src="/assets/images/2026-06-15-streamtrack-detail.png" style="max-width:35%; height:auto; border-radius: 12px;" />
  <figcaption style="margin-top: 0.5em; font-style: italic;">
    Series detail — ratings row, streaming availability chips, season breakdown
    with interactive episode checkboxes
  </figcaption>
</figure>

<h3 id="my-list">My List</h3>

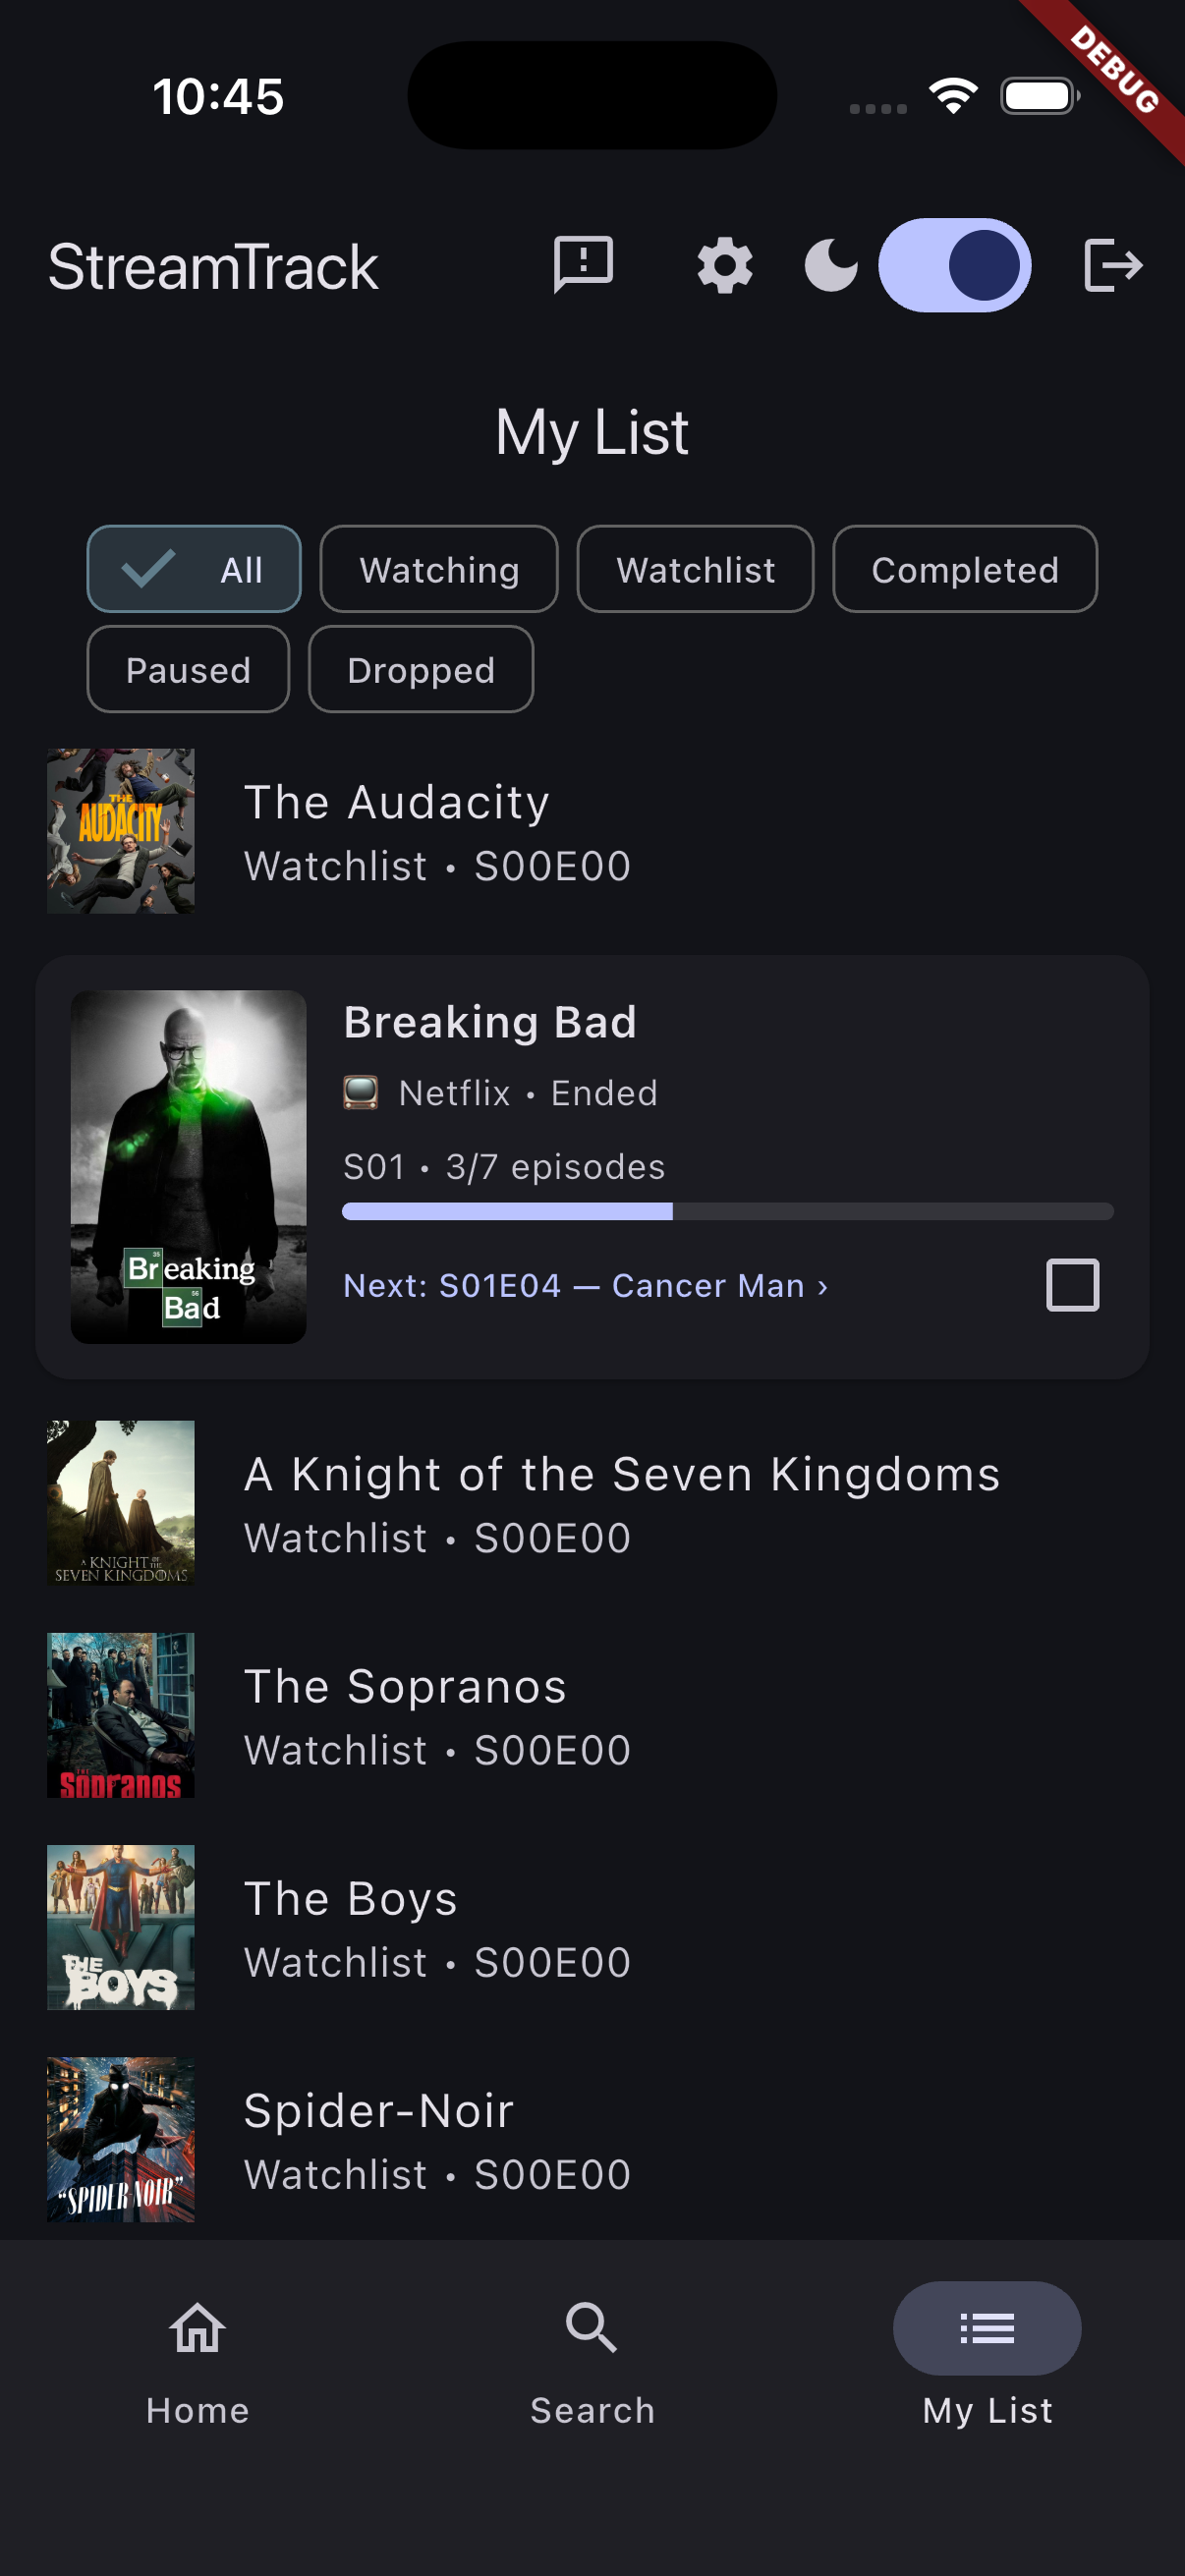
<p>Filter chips let you switch between <em>All</em>, <em>Watching</em>, <em>Completed</em>, and <em>On Hold</em>.
Cards show poster, platform, progress (S02E04), and the name of the next episode.
Swipe to delete with an undo snackbar. Pull to refresh. Within <em>Watching</em>, series
with pending episodes float to the top.</p>

<figure style="display: flex; flex-direction: column; align-items: center;">
  <img src="/assets/images/2026-06-15-streamtrack-mylist.png" style="max-width:35%; height:auto; border-radius: 12px;" />
  <figcaption style="margin-top: 0.5em; font-style: italic;">
    My List — filter chips, watching cards with platform, progress bar and next
    episode name
  </figcaption>
</figure>

<h3 id="settings">Settings</h3>

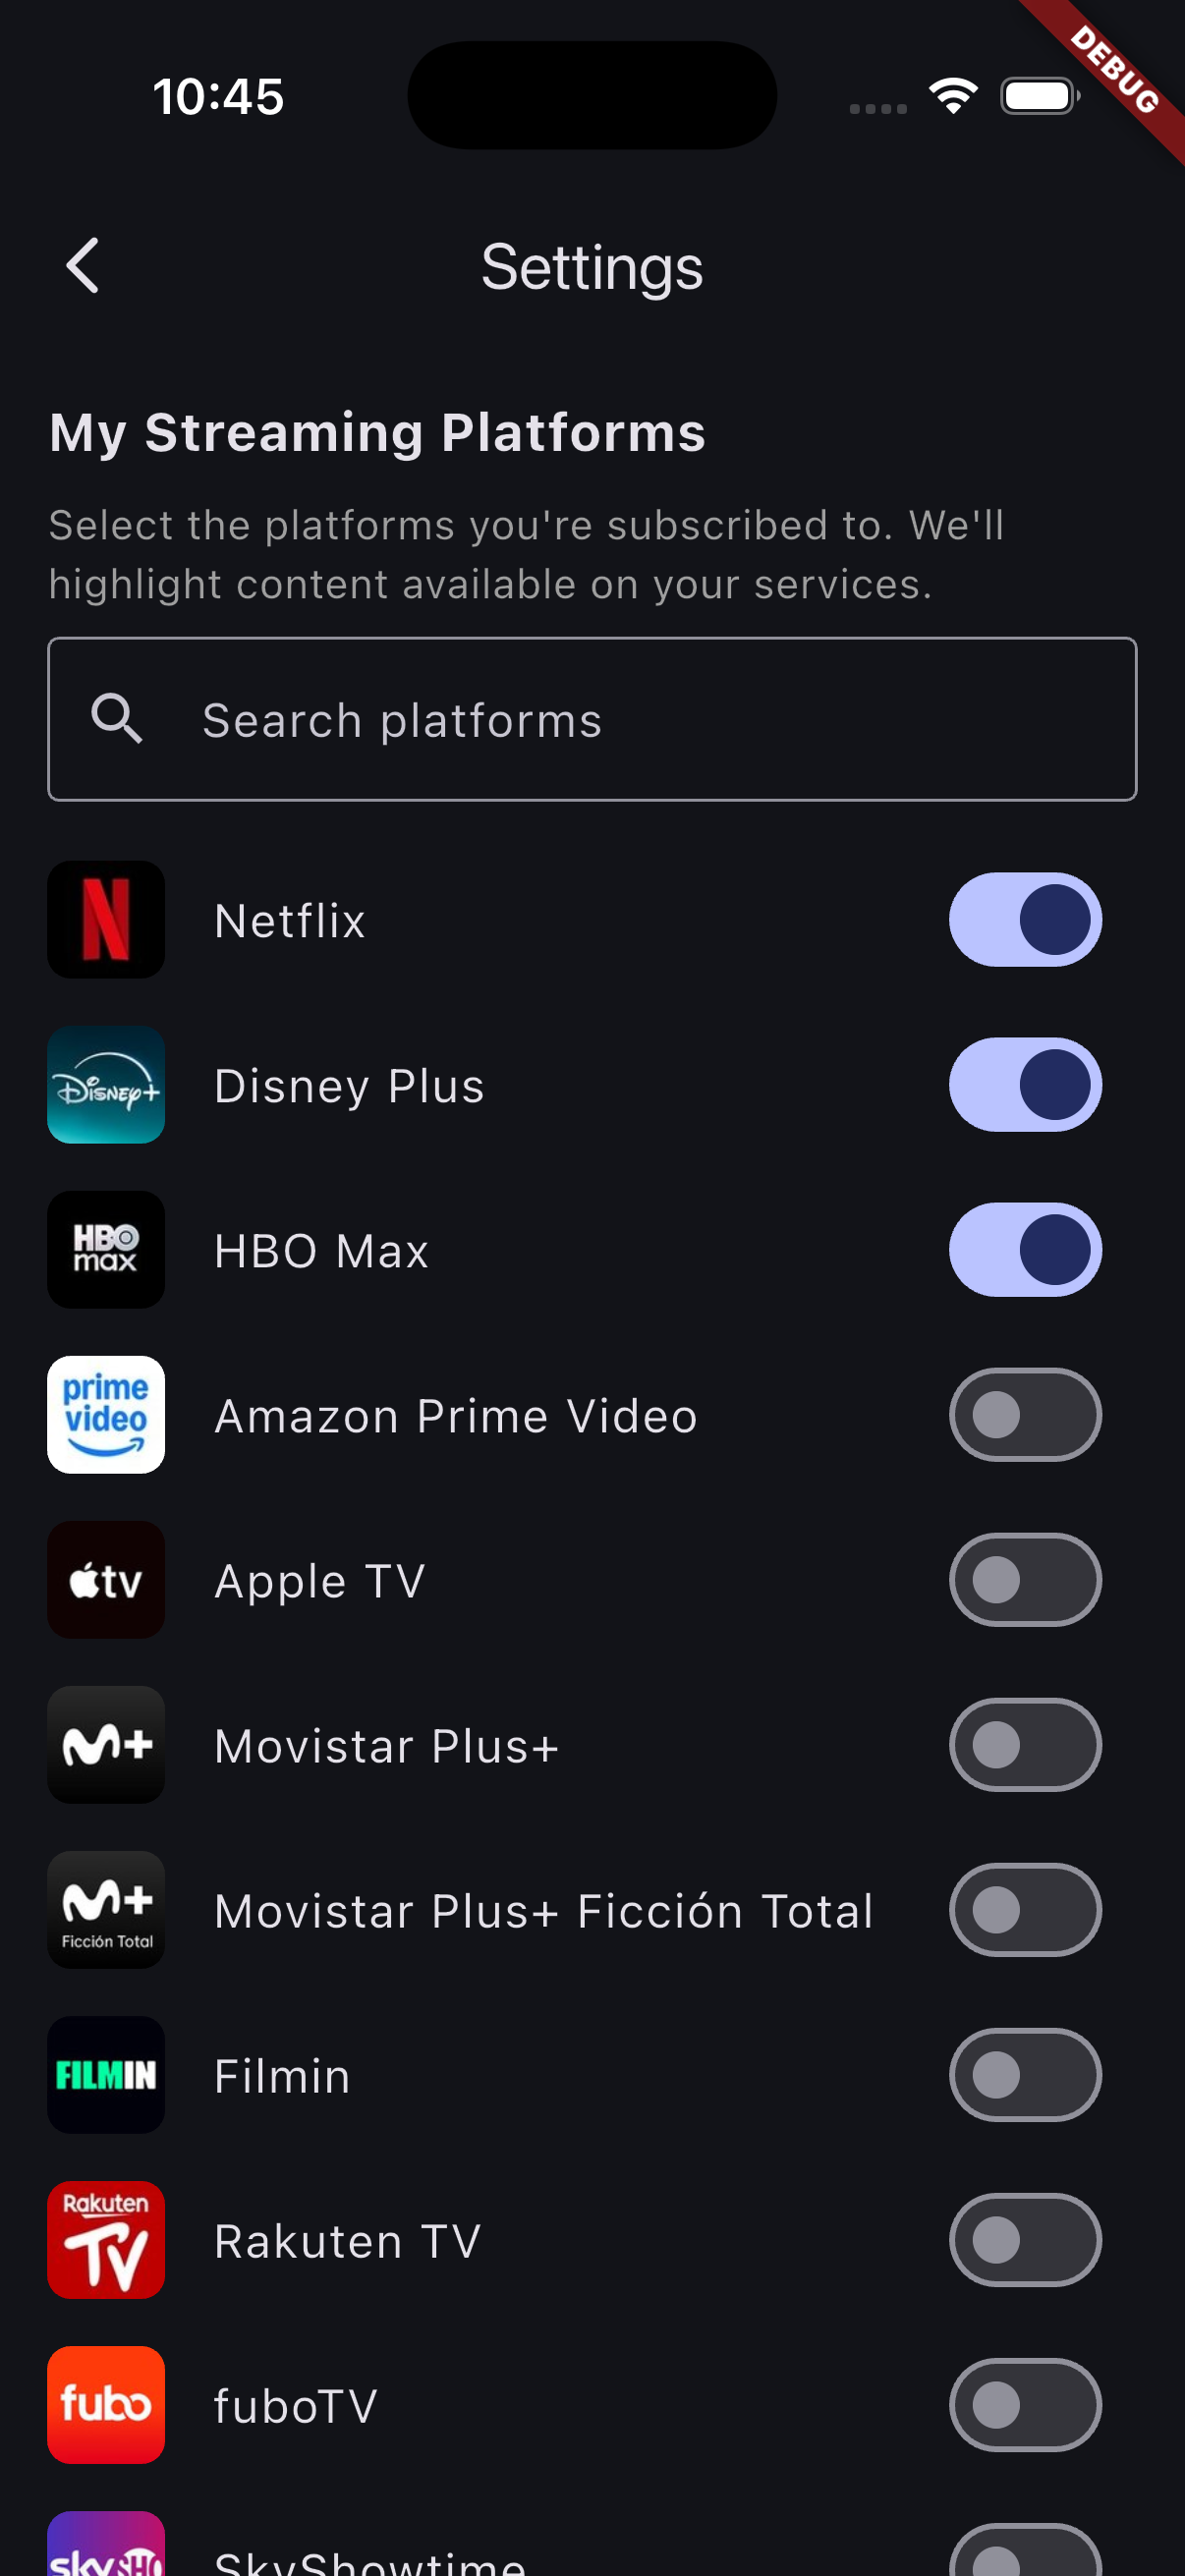
<p>The settings screen loads all available streaming platforms for your country
dynamically from the API, complete with logos. Toggle your services on or off —
changes save automatically. Selected platforms move to the top. From that moment,
the entire app adapts: Home filters trending content to your services, Search
badges matching results, and Detail highlights where you can actually watch something.</p>

<figure style="display: flex; flex-direction: column; align-items: center;">
  <img src="/assets/images/2026-06-15-streamtrack-settings.png" style="max-width:35%; height:auto; border-radius: 12px;" />
  <figcaption style="margin-top: 0.5em; font-style: italic;">
    Settings — platform grid with logos, selected services highlighted and pinned
    to the top
  </figcaption>
</figure>

<hr />

<h2 id="light--dark-mode">Light / Dark Mode</h2>

<p>The app ships with full light and dark theme support. The toggle lives in the
AppBar — state persists across sessions. All status colors (watching, completed,
on hold, planned) adapt correctly to both themes.</p>

<figure style="display: flex; flex-direction: column; align-items: center;">
  <img src="/assets/images/2026-06-15-streamtrack-themes.jpg" style="max-width:35%; height:auto; border-radius: 12px;" />
  <figcaption style="margin-top: 0.5em; font-style: italic;">
    Dark and light mode — same screen, both themes
  </figcaption>
</figure>

<hr />

<h2 id="distribution-first-beta">Distribution: First Beta</h2>

<p><strong>Android</strong> testers receive APKs via a build script that packages the release build
and distributes it directly — no Play Store required for beta. <strong>iOS</strong> installation
is currently manual (cable + Xcode), with TestFlight planned before the public
launch.</p>

<p>The backend runs on Cloud Run (Madrid region, <code class="language-plaintext highlighter-rouge">europe-southwest1</code>) and the database
is live on Supabase PostgreSQL. Beta users authenticate with email and password via
Supabase Auth. Google Sign In and Apple Sign In are next on the roadmap before the
public store submission.</p>

<hr />

<h2 id="whats-next">What’s Next</h2>

<table>
  <thead>
    <tr>
      <th>Feature</th>
      <th>Status</th>
    </tr>
  </thead>
  <tbody>
    <tr>
      <td>Google Sign In + Apple Sign In</td>
      <td>🔜 Next</td>
    </tr>
    <tr>
      <td>Push notifications (new episodes)</td>
      <td>Planned</td>
    </tr>
    <tr>
      <td>AdMob + RevenueCat (freemium model)</td>
      <td>Planned</td>
    </tr>
    <tr>
      <td>Play Store + App Store</td>
      <td>Planned</td>
    </tr>
  </tbody>
</table>

<p>The freemium model is straightforward: core tracking features are free with ads,
and a premium subscription removes ads and unlocks advanced features — to be
defined as beta feedback comes in.</p>

<hr />

<h2 id="closing-thoughts">Closing Thoughts</h2>

<p>StreamTrack started as a personal itch to scratch and turned into a full
production-grade architecture: mobile + API + auth + cloud hosting, all for
$0/month at beta scale.</p>

<p>The most interesting part wasn’t the features — it was the sequence of decisions:
why a backend over BaaS-direct, why Supabase over Firebase, why Cloud Run over
Render. Each one had a concrete technical reason, not just preference.</p>

<p><strong>The beta is running.</strong> If you’re interested in trying it or following the
progress, reach out — I’d love the feedback.</p>

<hr />

<p><em>Last updated: June 2026</em></p>]]></content><author><name>Leoncio López</name><email>leobip27@gmail.com</email></author><category term="mobile" /><category term="flutter" /><category term="python" /><category term="flutter" /><category term="fastapi" /><category term="supabase" /><category term="cloud-run" /><category term="side-project" /><summary type="html"><![CDATA[Keeping track of what you’re watching across five different streaming services is surprisingly hard. You start a series on Netflix, continue it on a different device, forget what episode you were on, and end up rewatching fifteen minutes you’ve already seen.]]></summary></entry><entry><title type="html">When Your Pipeline Becomes the Platform</title><link href="https://leobip.github.io/git/cicd/pipelines/pipeline-becomes-platform/" rel="alternate" type="text/html" title="When Your Pipeline Becomes the Platform" /><published>2026-03-30T08:00:00+02:00</published><updated>2026-03-30T08:00:00+02:00</updated><id>https://leobip.github.io/git/cicd/pipelines/pipeline-becomes-platform</id><content type="html" xml:base="https://leobip.github.io/git/cicd/pipelines/pipeline-becomes-platform/"><![CDATA[<p>When Your Pipeline Becomes the Platform</p>

<h2 id="introduction">Introduction</h2>

<p>A well-designed automation pipeline is far more than just CI/CD — it’s the backbone of modern infrastructure delivery.</p>

<p>From an automation perspective, it is fascinating how we can integrate a wide range of tools, technologies, languages, and processes into a unified workflow capable of achieving complex goals. The ability to chain identity federation, infrastructure provisioning, scripting, and multi-repository orchestration into a single coherent flow is what separates a <em>pipeline</em> from a <em>platform</em>.</p>

<p>Modern delivery systems are increasingly expected to orchestrate full lifecycle operations: executing tests, provisioning storage, creating environments, and coordinating deployments across multiple repositories. In mature setups, the pipeline is no longer just a build runner — it becomes a <strong>distributed control layer</strong> that governs how infrastructure is created, configured, and maintained.</p>

<p>This shift is precisely what motivated the work described here.</p>

<hr />

<h2 id="project-context">Project Context</h2>

<p>In a recent initiative, I designed and implemented an automation framework centered on <strong>GitLab CI</strong> that integrates:</p>

<ul>
  <li><strong>Workload Identity Federation (OIDC)</strong> — for secretless, token-based cloud authentication</li>
  <li><strong>Terraform</strong> — as the Infrastructure as Code backbone</li>
  <li><strong>Reusable multi-repository pipeline components</strong> — shared CI/CD logic across projects</li>
  <li><strong>Custom automation scripts</strong> (Bash, Python, or any preferred language) — for programmable orchestration logic</li>
</ul>

<p>The primary objective was to enable <strong>secure, scalable, and reusable infrastructure orchestration</strong>, moving away from isolated pipeline jobs toward a platform-oriented approach.</p>

<blockquote>
  <p>⚠️ <strong>Note:</strong> This project is actively under development. The architecture described here represents the current state, but we are continuously iterating — adding new automation jobs, improving existing ones, and expanding coverage. This article will be updated as the platform evolves.</p>
</blockquote>

<hr />

<h2 id="architecture-overview">Architecture Overview</h2>

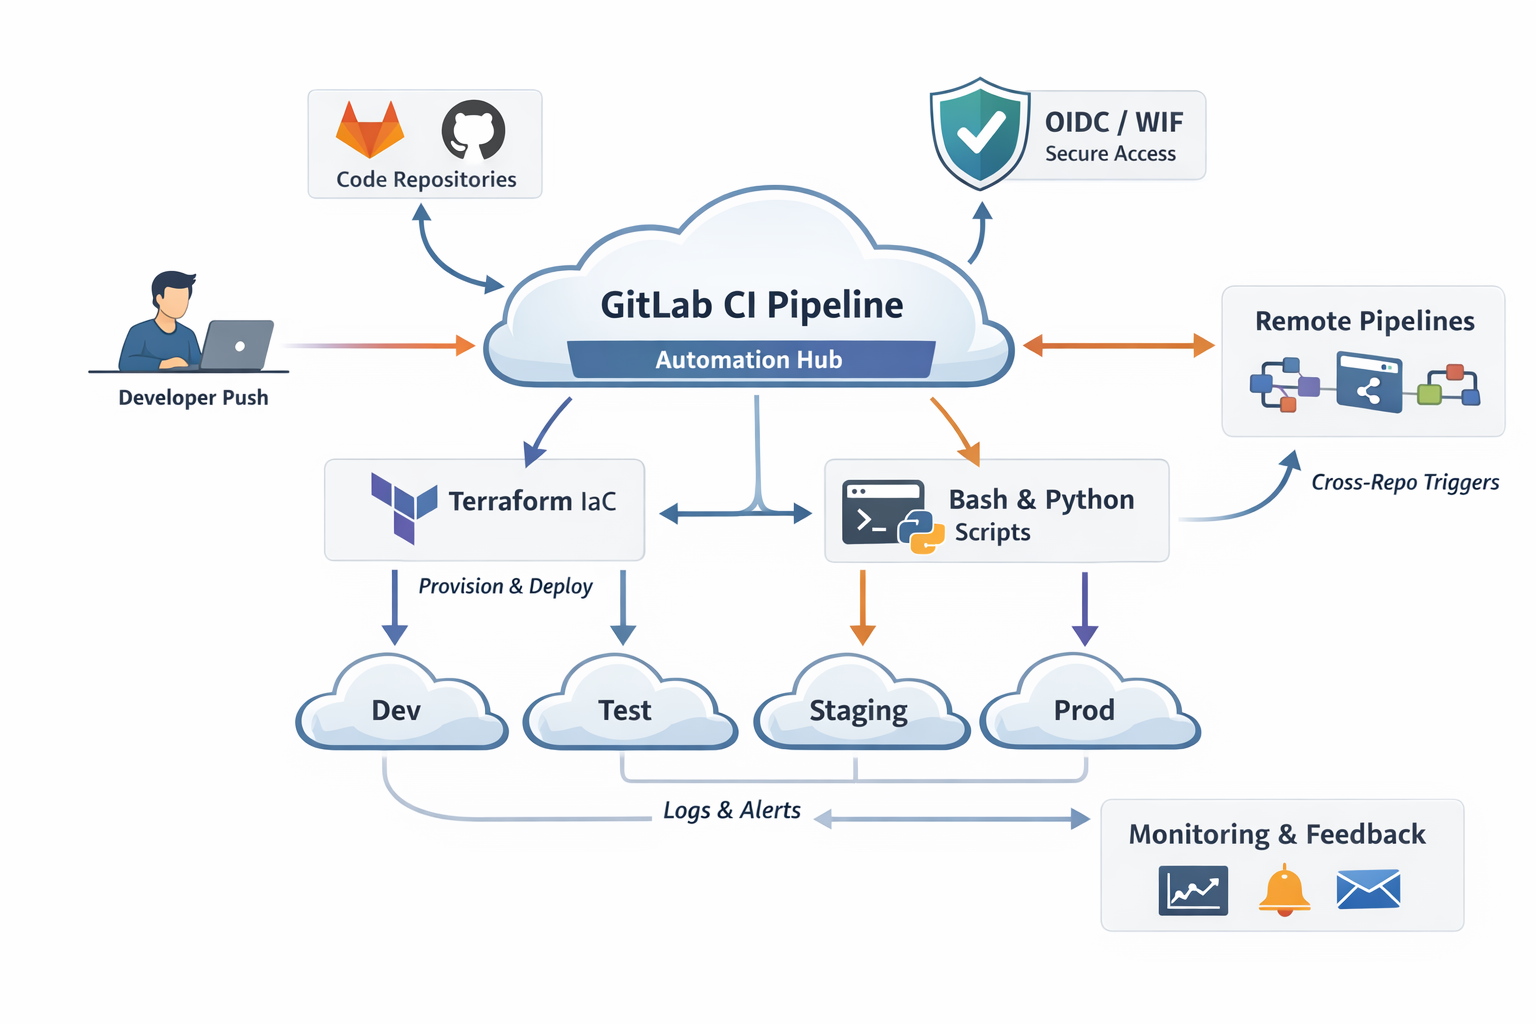
<p>The following diagram represents the conceptual architecture and flow of the system:</p>

<figure style="display: flex; flex-direction: column; align-items: center;">
  <img src="/assets/images/2026-03-30-pipelines.png" style="max-width:100%; height:auto;" />
  <figcaption style="margin-top: 0.5em; font-style: italic;">
  </figcaption>
</figure>

<p>At a high level, the system operates as follows:</p>

<ol>
  <li>A <strong>developer pushes code</strong> to a GitLab repository</li>
  <li>The <strong>GitLab CI pipeline</strong> acts as the central Automation Hub</li>
  <li>The pipeline requests an <strong>OIDC token</strong> from GitLab</li>
  <li><strong>Workload Identity Federation</strong> exchanges the token for temporary cloud credentials — no static secrets involved</li>
  <li><strong>Terraform</strong> provisions or updates infrastructure across target environments (Dev, Test, Staging, Prod)</li>
  <li><strong>Custom Bash &amp; Python scripts</strong> orchestrate additional logic, validations, and workflows</li>
  <li>The pipeline <strong>triggers downstream pipelines</strong> across multiple repositories via cross-repo triggers</li>
  <li>Target environments are <strong>bootstrapped automatically</strong> with all required resources</li>
  <li><strong>Monitoring &amp; Feedback</strong> loops provide visibility through logs, alerts, and notifications</li>
</ol>

<p>This model enables strong security guarantees while maintaining a high degree of automation and flexibility.</p>

<hr />

<h2 id="key-design-principles">Key Design Principles</h2>

<h3 id="-secretless-authentication">🔐 Secretless Authentication</h3>

<p>By leveraging OIDC and Workload Identity Federation, the pipeline avoids static credentials entirely. Trust is dynamically established at runtime based on the pipeline’s identity.</p>

<p><strong>How it works:</strong></p>
<ul>
  <li>GitLab issues a short-lived OIDC token for each pipeline execution</li>
  <li>The cloud provider validates the token against a pre-configured trust policy</li>
  <li>Temporary credentials are issued with scoped permissions</li>
  <li>Credentials expire automatically — no rotation needed</li>
</ul>

<p><strong>Impact:</strong></p>
<ul>
  <li>Eliminated credential leakage risk</li>
  <li>Simplified credential lifecycle management</li>
  <li>Improved auditability and traceability</li>
  <li>Compliance-friendly by design</li>
</ul>

<hr />

<h3 id="️-reusable-pipeline-components">♻️ Reusable Pipeline Components</h3>

<p>Instead of duplicating CI/CD logic across repositories, pipelines are designed as <strong>reusable building blocks</strong> hosted in a central repository. Any project — regardless of team or domain — can adopt the full automation pipeline with a single <code class="language-plaintext highlighter-rouge">include</code> directive pointing to the central repo.</p>

<p><strong>How it works:</strong></p>
<ul>
  <li>The complete pipeline logic lives in a dedicated central repository</li>
  <li>Any remote project can consume it by adding a simple <code class="language-plaintext highlighter-rouge">include: remote</code> in their <code class="language-plaintext highlighter-rouge">.gitlab-ci.yml</code></li>
  <li>In many cases, only <strong>minimal YAML configuration</strong> is needed — a few variables to define the project’s context</li>
  <li>The complexity is fully abstracted: the user doesn’t need to understand the underlying orchestration</li>
  <li>Updates to the central pipeline propagate automatically to all consumers</li>
</ul>

<p><strong>Example — what the user sees:</strong></p>
<div class="language-yaml highlighter-rouge"><div class="highlight"><pre class="highlight"><code><span class="na">include</span><span class="pi">:</span>
  <span class="pi">-</span> <span class="na">project</span><span class="pi">:</span> <span class="s1">'</span><span class="s">platform/automation-pipeline'</span>
    <span class="na">ref</span><span class="pi">:</span> <span class="s">main</span>
    <span class="na">file</span><span class="pi">:</span> <span class="s1">'</span><span class="s">/templates/full-pipeline.yml'</span>

<span class="na">variables</span><span class="pi">:</span>
  <span class="na">ENV</span><span class="pi">:</span> <span class="s2">"</span><span class="s">dev"</span>
  <span class="na">PROJECT_NAME</span><span class="pi">:</span> <span class="s2">"</span><span class="s">my-service"</span>
</code></pre></div></div>

<p>That’s it. The entire automation framework — OIDC auth, Terraform provisioning, environment bootstrapping — is available with just a few lines.</p>

<p><strong>Benefits:</strong></p>
<ul>
  <li><strong>Dead simple adoption</strong> — teams don’t build pipelines, they just include one</li>
  <li>Standardization across teams and projects</li>
  <li>Dramatically reduced duplication and maintenance burden</li>
  <li>Faster onboarding — new projects get full pipeline capabilities instantly</li>
  <li>Consistent security and quality practices</li>
  <li>Central updates benefit all consumers immediately</li>
</ul>

<hr />

<h3 id="-automation-as-a-first-class-capability">🧠 Automation as a First-Class Capability</h3>

<p>Automation is not limited to predefined CI/CD steps. By integrating scripting capabilities (Bash, Python, or any preferred language), pipelines can:</p>

<ul>
  <li>Execute <strong>complex decision logic</strong> based on runtime conditions</li>
  <li><strong>Dynamically adapt</strong> to context (branch, environment, configuration)</li>
  <li><strong>Orchestrate cross-system workflows</strong> spanning multiple tools and APIs</li>
  <li>Perform <strong>data transformations</strong>, validations, and pre/post-processing</li>
  <li>Interact with <strong>external services</strong> (APIs, databases, notification systems)</li>
</ul>

<p>This transforms pipelines from static execution sequences into <strong>programmable automation layers</strong> that can handle arbitrarily complex workflows.</p>

<hr />

<h3 id="️-idempotent-infrastructure-with-terraform">🏗️ Idempotent Infrastructure with Terraform</h3>

<p>Terraform ensures that infrastructure provisioning is consistent, repeatable, and declarative. Every environment is defined as code, and every change is tracked and versioned.</p>

<p><strong>Key practices:</strong></p>
<ul>
  <li><strong>Strict state management</strong> — remote state with locking to prevent conflicts</li>
  <li><strong>Parameterized environments</strong> — same modules, different configurations</li>
  <li><strong>Controlled apply workflows</strong> — plan → review → apply with approval gates</li>
  <li><strong>Drift detection and correction</strong> — automated checks against desired state</li>
  <li><strong>Module reuse</strong> — shared Terraform modules for common infrastructure patterns</li>
</ul>

<hr />

<h3 id="-environment-bootstrapping-on-demand">🚀 Environment Bootstrapping on Demand</h3>

<p>One of the most powerful capabilities is the ability to <strong>create complete environments directly from the pipeline</strong> — no tickets, no waiting, no manual steps.</p>

<p><strong>This includes:</strong></p>
<ul>
  <li>Cloud resource provisioning (compute, storage, networking)</li>
  <li>Service configuration and initialization</li>
  <li>Identity and access setup (service accounts, roles, permissions)</li>
  <li>Cross-repository orchestration for dependent services</li>
  <li>Configuration injection and secret management</li>
</ul>

<p><strong>The result:</strong> A self-service platform experience where teams can provision fully functional environments (Dev, Test, Staging, Prod) without manual intervention.</p>

<hr />

<h2 id="from-pipeline-to-platform">From Pipeline to Platform</h2>

<p>The real shift is <strong>conceptual</strong>, not just technical.</p>

<p>Pipelines are no longer just execution units — they become:</p>

<table>
  <thead>
    <tr>
      <th>Traditional View</th>
      <th>Platform View</th>
    </tr>
  </thead>
  <tbody>
    <tr>
      <td>Build runner</td>
      <td><strong>Orchestration engine</strong></td>
    </tr>
    <tr>
      <td>Deploy tool</td>
      <td><strong>Integration layer</strong></td>
    </tr>
    <tr>
      <td>Job executor</td>
      <td><strong>Security boundary</strong></td>
    </tr>
    <tr>
      <td>CI/CD step</td>
      <td><strong>Platform control plane</strong></td>
    </tr>
  </tbody>
</table>

<p>This approach reduces the gap between development workflows and infrastructure operations, aligning both under a <strong>unified automation model</strong>. Developers don’t need to understand the underlying complexity — they push code, and the platform handles the rest.</p>

<hr />

<h2 id="current-jobs--capabilities">Current Jobs &amp; Capabilities</h2>

<p>The following automation jobs are currently implemented and operational:</p>

<table>
  <thead>
    <tr>
      <th>Job</th>
      <th>Description</th>
      <th>Status</th>
    </tr>
  </thead>
  <tbody>
    <tr>
      <td><strong>OIDC Token Exchange</strong></td>
      <td>Authenticates pipeline to cloud provider via WIF</td>
      <td>✅ Active</td>
    </tr>
    <tr>
      <td><strong>Terraform Plan &amp; Apply</strong></td>
      <td>Provisions infrastructure across environments</td>
      <td>✅ Active</td>
    </tr>
    <tr>
      <td><strong>Environment Bootstrap</strong></td>
      <td>Creates complete environments on demand</td>
      <td>✅ Active</td>
    </tr>
    <tr>
      <td><strong>Cross-Repo Trigger</strong></td>
      <td>Coordinates pipelines across multiple repositories</td>
      <td>✅ Active</td>
    </tr>
    <tr>
      <td><strong>Custom Script Execution</strong></td>
      <td>Runs Bash/Python automation scripts</td>
      <td>✅ Active</td>
    </tr>
    <tr>
      <td><strong>Monitoring Integration</strong></td>
      <td>Sends logs and alerts to observability stack</td>
      <td>✅ Active</td>
    </tr>
  </tbody>
</table>

<hr />

<h2 id="roadmap-whats-coming-next">Roadmap: What’s Coming Next</h2>

<p>This platform is under active development. Here’s a look at what we’re working on and planning:</p>

<h3 id="-short-term-improvements">🔜 Short-term Improvements</h3>
<ul>
  <li><strong>Enhanced rollback automation</strong> — automated rollback jobs triggered on deployment failures, with state snapshot recovery</li>
  <li><strong>Pipeline analytics dashboard</strong> — centralized visibility into pipeline execution times, failure rates, and resource consumption</li>
  <li><strong>Parameterized environment teardown</strong> — automated cleanup of ephemeral environments after a configurable TTL</li>
</ul>

<h3 id="️-planned-jobs--features">🛣️ Planned Jobs &amp; Features</h3>
<ul>
  <li><strong>Policy-as-Code integration</strong> — embedding OPA (Open Policy Agent) or Sentinel policies directly into the pipeline to enforce compliance before deployment</li>
  <li><strong>Secrets rotation automation</strong> — automated rotation of service account keys and certificates with zero-downtime transitions</li>
  <li><strong>Database migration orchestration</strong> — coordinated schema migrations across environments with validation checkpoints</li>
  <li><strong>Cost estimation job</strong> — pre-apply Terraform cost analysis using tools like Infracost, with budget threshold alerts</li>
  <li><strong>Security scanning integration</strong> — SAST, DAST, and container image scanning as mandatory pipeline stages</li>
  <li><strong>Ephemeral preview environments</strong> — spin up full environments per merge request for review and testing, with automatic teardown on merge</li>
</ul>

<h3 id="-long-term-vision">🔭 Long-term Vision</h3>
<ul>
  <li><strong>Event-driven pipeline triggers</strong> — reactive architectures where pipelines respond to cloud events (not just Git pushes)</li>
  <li><strong>Multi-cloud orchestration</strong> — extending the framework to provision and coordinate across AWS, GCP, and Azure from a single pipeline</li>
  <li><strong>Self-healing infrastructure</strong> — automated remediation jobs that detect drift and restore desired state without human intervention</li>
  <li><strong>Platform API layer</strong> — exposing pipeline capabilities through an internal API, enabling other tools and systems to trigger automation programmatically</li>
  <li><strong>AI-assisted pipeline optimization</strong> — leveraging ML models to predict failures, optimize resource allocation, and suggest pipeline improvements</li>
</ul>

<blockquote>
  <p>💡 Each new job and feature will be documented here as it becomes available. The goal is to build a living platform that grows with the team’s needs.</p>
</blockquote>

<hr />

<h2 id="current-limitations-and-considerations">Current Limitations and Considerations</h2>

<p>No architecture is without trade-offs. Key challenges we’re actively addressing include:</p>

<table>
  <thead>
    <tr>
      <th>Challenge</th>
      <th>Description</th>
      <th>Mitigation Strategy</th>
    </tr>
  </thead>
  <tbody>
    <tr>
      <td><strong>OIDC trust boundaries</strong></td>
      <td>Configuring fine-grained trust policies across projects</td>
      <td>Least-privilege attribute conditions</td>
    </tr>
    <tr>
      <td><strong>Terraform state isolation</strong></td>
      <td>Preventing state conflicts in multi-team scenarios</td>
      <td>Separate state files per environment + locking</td>
    </tr>
    <tr>
      <td><strong>Cross-project permissions</strong></td>
      <td>Managing access across repository boundaries</td>
      <td>Scoped tokens + project-level access controls</td>
    </tr>
    <tr>
      <td><strong>Distributed debugging</strong></td>
      <td>Tracing issues across multi-repo pipeline chains</td>
      <td>Centralized logging + correlation IDs</td>
    </tr>
    <tr>
      <td><strong>Failure handling</strong></td>
      <td>Managing partial failures in multi-step workflows</td>
      <td>Checkpoint-based recovery + idempotent design</td>
    </tr>
  </tbody>
</table>

<p>These aspects require careful design as the platform scales, and they inform our roadmap priorities.</p>

<hr />

<h2 id="looking-forward">Looking Forward</h2>

<p>The trajectory is clear: <strong>pipelines are evolving into platform primitives</strong>.</p>

<p>In the near future, we can expect:</p>

<ul>
  <li>🏛️ Deeper integration with <strong>policy engines</strong> for automated governance</li>
  <li>⚡ <strong>Event-driven and reactive</strong> pipeline architectures</li>
  <li>🔗 Tighter coupling with <strong>platform APIs</strong> and service meshes</li>
  <li>🌫️ Increased use of <strong>ephemeral environments</strong> for testing and review</li>
  <li>🪪 Standardization of <strong>federated identity patterns</strong> across CI/CD platforms</li>
  <li>🤖 <strong>AI-augmented operations</strong> for predictive scaling and anomaly detection</li>
</ul>

<p>Organizations that embrace this shift early will gain significant advantages in scalability, security, and operational efficiency.</p>

<hr />

<h2 id="closing-thoughts">Closing Thoughts</h2>

<p>Moving beyond traditional CI/CD requires rethinking the role of automation pipelines.</p>

<p>When combined with federated identity, Infrastructure as Code, and programmable automation, pipelines become a powerful abstraction layer for building secure, scalable, and reusable platforms.</p>

<p><strong>This work is actively evolving.</strong> We’re building in the open, iterating on real-world feedback, and continuously expanding the platform’s capabilities. If you’re interested in following the progress or discussing similar approaches, I’d love to connect.</p>

<p>The direction is clear — and we’re just getting started. 🚀</p>

<hr />

<p><em>Last updated: March 2026</em></p>]]></content><author><name>Leoncio López</name><email>leobip27@gmail.com</email></author><category term="git" /><category term="cicd" /><category term="pipelines" /><category term="git-flow" /><category term="automation" /><summary type="html"><![CDATA[When Your Pipeline Becomes the Platform]]></summary></entry><entry><title type="html">📡 Local Monitoring Stack for Kubernetes</title><link href="https://leobip.github.io/devops/kubernetes/local-monitoring-env/" rel="alternate" type="text/html" title="📡 Local Monitoring Stack for Kubernetes" /><published>2025-07-26T18:32:04+02:00</published><updated>2025-07-26T18:32:04+02:00</updated><id>https://leobip.github.io/devops/kubernetes/local-monitoring-env</id><content type="html" xml:base="https://leobip.github.io/devops/kubernetes/local-monitoring-env/"><![CDATA[<h1 id="-local-monitoring-stack-for-kubernetes-prometheus--grafana--kafka">📡 Local Monitoring Stack for Kubernetes (Prometheus + Grafana + Kafka)</h1>

<p>https://github.com/leobip/monitoring.git</p>

<p>Welcome! 👋
This project sets up a local monitoring stack based on Prometheus, Grafana, and Kafka (with Kafka UI), using Helm charts and persistent volumes for durability.</p>

<p>Whether you’re experimenting with Kubernetes, developing custom controllers, or just want to see your cluster’s activity in real time — this guide has got you covered.
By the end, you’ll have a working environment where:</p>

<p>Prometheus collects metrics from your apps and infrastructure 🧲</p>

<p>Grafana helps you visualize those metrics with beautiful dashboards 📊</p>

<p>Kafka acts as a telemetry backbone, and Kafka-UI lets you explore the events flowing through it 🔄</p>

<p>This setup runs entirely on your local machine, making it ideal for testing and development — no cloud account or external services required!</p>

<hr />

<h2 id="-what-youll-get">🚀 What You’ll Get</h2>

<p>Once deployed, your local monitoring stack will include:</p>

<p>✅ A Prometheus instance, scraping metrics on port 30090</p>

<p>✅ A Grafana dashboard, accessible at localhost:30095</p>

<p>✅ A Kafka broker with persistent volumes</p>

<p>✅ Kafka UI at localhost:30096 to inspect topics and messages</p>

<p>✅ A health check script to ensure everything is up and running</p>

<hr />

<h2 id="-prometheus--grafana">📦 Prometheus + Grafana</h2>

<p>We’ll use the official Helm charts from Bitnami and Prometheus Community, with a few tweaks for local development and persistence. See values files for config details.</p>

<h2 id="-kafka--kafka-ui">🧱 Kafka + Kafka UI</h2>

<p>This section helps you install Kafka in plaintext mode, along with a lightweight UI to browse topics and messages.</p>

<p>Persistent volumes are enabled so your topics and messages stick around across Minikube restarts.</p>

<hr />

<h2 id="-folder-structure">🧱 Folder Structure</h2>

<div class="language-bash highlighter-rouge"><div class="highlight"><pre class="highlight"><code>monitoring/
├── deploy-all.sh <span class="c"># Script to install all components</span>
├── pv/ <span class="c"># Persistent volume manifests</span>
│ ├── kafka-pv.yaml
│ ├── prometheus-pv.yaml
│ └── grafana-pv.yaml
└── values/ <span class="c"># Helm values for each component</span>
  ├── kafka-values.yaml
  ├── kafka-ui-values.yaml
  ├── prometheus-values.yaml
  └── grafana-values.yaml
</code></pre></div></div>

<hr />

<h2 id="️-prerequisites">🛠️ Prerequisites</h2>

<p>Make sure you have the following installed:</p>

<ul>
  <li><a href="https://minikube.sigs.k8s.io/">Minikube</a></li>
  <li><a href="https://kubernetes.io/docs/tasks/tools/">kubectl</a></li>
  <li><a href="https://helm.sh/docs/intro/install/">Helm</a></li>
</ul>

<blockquote>
  <p>This setup assumes you’re running Kubernetes locally with Minikube.</p>
</blockquote>

<hr />

<h2 id="-installation">🚀 Installation</h2>

<h3 id="1-start-minikube">1.– Start Minikube</h3>

<div class="language-bash highlighter-rouge"><div class="highlight"><pre class="highlight"><code>minikube start <span class="nt">--memory</span><span class="o">=</span>4g <span class="nt">--cpus</span><span class="o">=</span>2
</code></pre></div></div>

<h3 id="2--add-helm-repositories">2.- Add Helm repositories</h3>

<ul>
  <li>This step is added in the script: Just uncomment de section</li>
</ul>

<h3 id="3--run-the-install-script">3.- Run the install script</h3>

<div class="language-bash highlighter-rouge"><div class="highlight"><pre class="highlight"><code><span class="nb">cd </span>monitoring
<span class="nb">chmod</span> +x deploy-all.sh
./deploy-all.sh
</code></pre></div></div>

<ul>
  <li>This script will:
    <ul>
      <li>Create a monitoring namespace.</li>
      <li>Apply persistent volumes from pv/.</li>
    </ul>
  </li>
</ul>

<h2 id="-access-to-monitoring-tools">📋 Access to Monitoring Tools</h2>

<table>
  <thead>
    <tr>
      <th>Tool</th>
      <th>External Access (NodePort)</th>
      <th>Internal Access (Cluster DNS)</th>
      <th>Important Notes</th>
    </tr>
  </thead>
  <tbody>
    <tr>
      <td><strong>Grafana</strong></td>
      <td><a href="http://192.168.49.2:30095">http://192.168.49.2:30095</a></td>
      <td><code class="language-plaintext highlighter-rouge">grafana.monitoring.svc.cluster.local</code></td>
      <td>- User: <code class="language-plaintext highlighter-rouge">admin</code> <br /> - Get password:<br /> <code class="language-plaintext highlighter-rouge">kubectl get secret -n monitoring grafana -o jsonpath="{.data.admin-password}" \| base64 --decode</code></td>
    </tr>
    <tr>
      <td><strong>Kafka</strong></td>
      <td>See ports with:<br /><code class="language-plaintext highlighter-rouge">kubectl get svc -n monitoring -l "app.kubernetes.io/instance=kafka,app.kubernetes.io/component=kafka,pod" -o jsonpath='{.items[*].spec.ports[0].nodePort}'</code></td>
      <td>- Client: <code class="language-plaintext highlighter-rouge">kafka.monitoring.svc.cluster.local:9092</code><br />- Brokers: <code class="language-plaintext highlighter-rouge">kafka-controller-0/1/2.kafka-controller-headless.monitoring.svc.cluster.local:9092</code></td>
      <td>- KRaft enabled<br />- EXTERNAL listener enabled<br />- Run a client with:<br /><code class="language-plaintext highlighter-rouge">kubectl run kafka-client --rm -it --image docker.io/bitnami/kafka:4.0.0-debian-12-r8 -n monitoring -- bash</code></td>
    </tr>
    <tr>
      <td><strong>Prometheus</strong></td>
      <td>Run:<br /><code class="language-plaintext highlighter-rouge">export NODE_PORT=$(kubectl get svc -n monitoring prometheus-server -o jsonpath="{.spec.ports[0].nodePort}")</code><br /><code class="language-plaintext highlighter-rouge">export NODE_IP=$(kubectl get nodes -o jsonpath="{.items[0].status.addresses[0].address}")</code><br /><code class="language-plaintext highlighter-rouge">echo http://$NODE_IP:$NODE_PORT</code></td>
      <td><code class="language-plaintext highlighter-rouge">prometheus-server.monitoring.svc.cluster.local</code></td>
      <td>- Server and AlertManager available<br />- AlertManager: port-forward:<br /><code class="language-plaintext highlighter-rouge">kubectl port-forward -n monitoring svc/prometheus-alertmanager 9093</code><br />- PushGateway: port-forward:<br /><code class="language-plaintext highlighter-rouge">kubectl port-forward -n monitoring svc/prometheus-prometheus-pushgateway 9091</code></td>
    </tr>
  </tbody>
</table>

<p>✅ Additional Notes</p>

<ul>
  <li>Minikube IP: 192.168.49.2 (verify with minikube ip if needed)</li>
  <li>Namespace: monitoring</li>
  <li>PVCs applied: grafana-pvc, kafka-pv, prometheus-pvc</li>
</ul>

<hr />

<h2 id="-verify-your-setup">🎯 Verify Your Setup</h2>

<p>Let’s make sure everything is working! You’ll check that Prometheus, Grafana, Kafka, and Kafka UI are all running and accessible via NodePorts.</p>

<h2 id="-accessing-tools-from-host-minikube--docker-on-macos">🔍 Accessing Tools from Host (Minikube + Docker on macOS)</h2>

<ul>
  <li>By default, services exposed via NodePort in Minikube may not be directly accessible from your host when using the Docker driver on macOS. This is due to networking limitations: the NodePort is exposed inside the Minikube VM/container, not on your host machine’s network.</li>
</ul>

<h3 id="get-the-name-of-the-tools-pods">Get the name of the tools pods</h3>

<div class="language-bash highlighter-rouge"><div class="highlight"><pre class="highlight"><code>❯ kubectl get svc <span class="nt">-n</span> monitoring
NAME                                  TYPE        CLUSTER-IP       EXTERNAL-IP    PORT<span class="o">(</span>S<span class="o">)</span>                      AGE
grafana                               NodePort    10.102.51.68     &lt;none&gt;         80:30095/TCP                 29m
kafka                                 ClusterIP   10.100.118.216   &lt;none&gt;         9092/TCP,9095/TCP            46m
kafka-controller-0-external           NodePort    10.109.227.109   192.168.49.2   9094:30092/TCP               46m
kafka-controller-1-external           NodePort    10.97.149.130    192.168.49.2   9094:30093/TCP               46m
kafka-controller-2-external           NodePort    10.99.194.34     192.168.49.2   9094:30094/TCP               46m
kafka-controller-headless             ClusterIP   None             &lt;none&gt;         9094/TCP,9092/TCP,9093/TCP   46m
kafka-jmx-metrics                     ClusterIP   10.99.29.148     &lt;none&gt;         5556/TCP                     46m
prometheus-alertmanager               ClusterIP   10.103.180.130   &lt;none&gt;         9093/TCP                     46m
prometheus-alertmanager-headless      ClusterIP   None             &lt;none&gt;         9093/TCP                     46m
prometheus-kube-state-metrics         ClusterIP   10.102.171.116   &lt;none&gt;         8080/TCP                     46m
prometheus-prometheus-node-exporter   ClusterIP   10.97.14.115     &lt;none&gt;         9100/TCP                     46m
prometheus-prometheus-pushgateway     ClusterIP   10.101.189.12    &lt;none&gt;         9091/TCP                     46m
prometheus-server                     NodePort    10.104.67.195    &lt;none&gt;         80:30090/TCP                 46m
</code></pre></div></div>

<h3 id="example">Example</h3>

<div class="language-bash highlighter-rouge"><div class="highlight"><pre class="highlight"><code>kubectl get svc <span class="nt">-n</span> monitoring grafana

NAME      TYPE       CLUSTER-IP     EXTERNAL-IP   PORT<span class="o">(</span>S<span class="o">)</span>        AGE
grafana   NodePort   10.102.51.68   &lt;none&gt;        80:30095/TCP   34m


kubectl get svc <span class="nt">-n</span> monitoring prometheus-server

NAME         TYPE       CLUSTER-IP     EXTERNAL-IP   PORT<span class="o">(</span>S<span class="o">)</span>          AGE
prometheus   NodePort   10.98.27.101   &lt;none&gt;        9090:31090/TCP   45m


kubectl get svc <span class="nt">-n</span> monitoring kafka-ui

NAME       TYPE       CLUSTER-IP     EXTERNAL-IP   PORT<span class="o">(</span>S<span class="o">)</span>          AGE
kafka-ui   NodePort   10.96.220.89   &lt;none&gt;        8080:30096/TCP   19m

</code></pre></div></div>

<div class="language-bash highlighter-rouge"><div class="highlight"><pre class="highlight"><code><span class="c"># ⚠️ IP may change on restart (check again)</span>
minikube ip
192.168.49.2
</code></pre></div></div>

<ul>
  <li><strong><em>You might expect <code class="language-plaintext highlighter-rouge">curl &lt;http://192.168.49.2:30095&gt;</code> to work, but it doesn’t respond.</em></strong></li>
</ul>

<h3 id="-option-1-minikube-service-temporary">🧪 Option 1: minikube service (Temporary)</h3>

<div class="language-bash highlighter-rouge"><div class="highlight"><pre class="highlight"><code><span class="c"># Grafana</span>
minikube service grafana <span class="nt">-n</span> monitoring

<span class="c"># Prometheus</span>
minikube service prometheus-server <span class="nt">-n</span> monitoring

<span class="c"># Kafka-ui</span>
minikube service kafka-ui <span class="nt">-n</span> monitoring

</code></pre></div></div>

<ul>
  <li>This opens a temporary proxy and shows a localhost URL like:</li>
</ul>

<pre><code class="language-psql"># Grafana
|------------|---------|-------------|---------------------------|
| NAMESPACE  |  NAME   | TARGET PORT |            URL            |
|------------|---------|-------------|---------------------------|
| monitoring | grafana | service/80  | http://192.168.49.2:30095 |
|------------|---------|-------------|---------------------------|
🏃  Starting tunnel for service grafana.
|------------|---------|-------------|------------------------|
| NAMESPACE  |  NAME   | TARGET PORT |          URL           |
|------------|---------|-------------|------------------------|
| monitoring | grafana |             | http://127.0.0.1:56851 |
|------------|---------|-------------|------------------------|
🎉  Opening service monitoring/grafana in default browser...
❗  Because you are using a Docker driver on darwin, the terminal needs to be open to run it.


# Prometheus
|------------|-------------------|-------------|---------------------------|
| NAMESPACE  |       NAME        | TARGET PORT |            URL            |
|------------|-------------------|-------------|---------------------------|
| monitoring | prometheus-server | http/80     | http://192.168.49.2:30090 |
|------------|-------------------|-------------|---------------------------|
🏃  Starting tunnel for service prometheus-server.
|------------|-------------------|-------------|------------------------|
| NAMESPACE  |       NAME        | TARGET PORT |          URL           |
|------------|-------------------|-------------|------------------------|
| monitoring | prometheus-server |             | http://127.0.0.1:56409 |
|------------|-------------------|-------------|------------------------|
🎉  Opening service monitoring/prometheus-server in default browser...
❗  Because you are using a Docker driver on darwin, the terminal needs to be open to run it.


# kafka
|------------|----------|-------------|---------------------------|
| NAMESPACE  |   NAME   | TARGET PORT |            URL            |
|------------|----------|-------------|---------------------------|
| monitoring | kafka-ui | http/8080   | http://192.168.49.2:30096 |
|------------|----------|-------------|---------------------------|
🏃  Starting tunnel for service kafka-ui.
|------------|----------|-------------|------------------------|
| NAMESPACE  |   NAME   | TARGET PORT |          URL           |
|------------|----------|-------------|------------------------|
| monitoring | kafka-ui |             | http://127.0.0.1:64903 |
|------------|----------|-------------|------------------------|

</code></pre>

<ul>
  <li>✅ Works immediately, opens browser
    <ul>
      <li>❗ Needs terminal to stay open (as it runs a local tunnel)</li>
      <li>❗ Not script-friendly or persistent</li>
    </ul>
  </li>
</ul>

<h3 id="persistent">persistent</h3>

<p>🛠 Option 2: kubectl port-forward (Persistent while running)</p>

<ul>
  <li>You can forward the Grafana service to a local port
    <ul>
      <li>With Lens, Openlens, K9s, etc</li>
      <li>Or via kubectl cmd in terminal</li>
    </ul>
  </li>
</ul>

<div class="language-bash highlighter-rouge"><div class="highlight"><pre class="highlight"><code>kubectl port-forward <span class="nt">-n</span> monitoring svc/grafana 30095:80

kubectl port-forward <span class="nt">-n</span> monitoring svc/prometheus 9090:9090

kubectl port-forward svc/kafka-ui 8080:8080 <span class="nt">-n</span> monitoring

</code></pre></div></div>

<ul>
  <li>
    <p><strong><em>NOTE: Yopu have to stop the temporary proxy with ctrl-c before stop minikube, and execute again on restart</em></strong></p>
  </li>
  <li>
    <p>Then visit (In this example):</p>
  </li>
</ul>

<div class="language-bash highlighter-rouge"><div class="highlight"><pre class="highlight"><code><span class="c"># grafana</span>
http://localhost:30095

<span class="c"># prometheus</span>
http://localhost:9090

<span class="c"># kafka</span>
http://localhost:9093

</code></pre></div></div>

<ul>
  <li><strong>Login</strong>
    <ul>
      <li><em>Grafana:</em>
        <ul>
          <li>user: admin</li>
          <li>password: admin***</li>
        </ul>
      </li>
    </ul>
  </li>
  <li>✅ Works reliably
    <ul>
      <li>❗ Still requires the terminal to stay open</li>
      <li>❗ Better suited for dev workflows, or when using tools like Lens/K9s which manage this automatically</li>
    </ul>
  </li>
</ul>

<h3 id="-option-3-minikube-tunnel-recommended-for-real-external-access">🛡 Option 3: minikube tunnel (Recommended for real external access)</h3>

<ul>
  <li>Only if you define type: as LoadBalancer instead of NodePort</li>
</ul>

<div class="language-bash highlighter-rouge"><div class="highlight"><pre class="highlight"><code>minikube tunnel
</code></pre></div></div>

<ul>
  <li>Exposes NodePort and LoadBalancer services to your macOS host.</li>
  <li>Runs in background (but requires admin privileges).</li>
  <li>Makes the minikube ip + NodePort combination work:</li>
</ul>

<div class="language-bash highlighter-rouge"><div class="highlight"><pre class="highlight"><code>curl http://192.168.49.2:30095
...
</code></pre></div></div>

<ul>
  <li><strong>✅ Best if you want persistent access via actual cluster IP</strong></li>
  <li><strong>⚠️ You’ll need to keep the tunnel running in a terminal</strong></li>
</ul>

<h3 id="summary">Summary</h3>

<table>
  <thead>
    <tr>
      <th>Method</th>
      <th>Persistent</th>
      <th>Scriptable</th>
      <th>Requires open terminal</th>
      <th>Notes</th>
    </tr>
  </thead>
  <tbody>
    <tr>
      <td><code class="language-plaintext highlighter-rouge">minikube service</code></td>
      <td>❌</td>
      <td>❌</td>
      <td>✅</td>
      <td>Great for quick UI testing</td>
    </tr>
    <tr>
      <td><code class="language-plaintext highlighter-rouge">kubectl port-forward</code></td>
      <td>❌</td>
      <td>✅</td>
      <td>✅</td>
      <td>Ideal during dev/debug</td>
    </tr>
    <tr>
      <td><code class="language-plaintext highlighter-rouge">minikube tunnel</code></td>
      <td>✅</td>
      <td>✅</td>
      <td>✅ (background)</td>
      <td>Best for stable external access</td>
    </tr>
  </tbody>
</table>

<h3 id="tools-summary">Tools Summary</h3>

<table>
  <thead>
    <tr>
      <th>Service</th>
      <th>Method</th>
      <th>Persistent</th>
      <th>Host Access</th>
      <th>Notes</th>
    </tr>
  </thead>
  <tbody>
    <tr>
      <td><strong>Grafana</strong></td>
      <td><code class="language-plaintext highlighter-rouge">minikube service</code></td>
      <td>❌</td>
      <td>✅</td>
      <td>UI test only</td>
    </tr>
    <tr>
      <td> </td>
      <td><code class="language-plaintext highlighter-rouge">kubectl port-fwd</code></td>
      <td>❌</td>
      <td>✅</td>
      <td>Dev access</td>
    </tr>
    <tr>
      <td> </td>
      <td><code class="language-plaintext highlighter-rouge">minikube tunnel</code></td>
      <td>✅</td>
      <td>✅</td>
      <td>Needed for NodePort from host</td>
    </tr>
    <tr>
      <td><strong>Prometheus</strong></td>
      <td>Same as above</td>
      <td>Same</td>
      <td>Same</td>
      <td>Accessible at port 9090</td>
    </tr>
    <tr>
      <td><strong>Kafka</strong></td>
      <td><code class="language-plaintext highlighter-rouge">port-fwd 9093</code></td>
      <td>❌</td>
      <td>✅ (TLS)</td>
      <td>For testing with TLS listener</td>
    </tr>
    <tr>
      <td> </td>
      <td><code class="language-plaintext highlighter-rouge">minikube tunnel</code></td>
      <td>✅</td>
      <td>✅</td>
      <td>Needed for TLS access from host tools</td>
    </tr>
  </tbody>
</table>

<h2 id="-stopping-and-restarting-minikube-safely">🔄 Stopping and Restarting Minikube Safely</h2>

<p><strong><em>♻️ Minikube Lifecycle (Shutdown / Restart)</em></strong></p>

<p>To safely shut down and restart your monitoring stack without losing data or encountering errors:</p>

<h3 id="-stop-minikube">✅ Stop Minikube</h3>

<ul>
  <li>Use minikube stop instead of deleting the cluster:
    <ul>
      <li>This safely shuts down the VM/container.</li>
      <li>PVCs and all service configurations remain intact.</li>
    </ul>
  </li>
</ul>

<div class="language-bash highlighter-rouge"><div class="highlight"><pre class="highlight"><code>minikube stop
</code></pre></div></div>

<h3 id="-start-again-later">✅ Start Again Later</h3>

<ul>
  <li>This restores the full state, including your deployed services, PVCs, and Helm releases.
    <ul>
      <li>All NodePorts and persistent data remain available.</li>
    </ul>
  </li>
</ul>

<div class="language-bash highlighter-rouge"><div class="highlight"><pre class="highlight"><code>minikube start
</code></pre></div></div>

<p><strong><em>⚠️ Do Not Use</em></strong></p>

<ul>
  <li>❌ This deletes all volumes, pods, secrets, configs — use only if you want a clean reset.</li>
</ul>

<div class="language-bash highlighter-rouge"><div class="highlight"><pre class="highlight"><code>minikube delete
</code></pre></div></div>

<h3 id="-check-status">🧪 Check Status</h3>

<div class="language-bash highlighter-rouge"><div class="highlight"><pre class="highlight"><code>kubectl get pods <span class="nt">-n</span> monitoring
</code></pre></div></div>

<ul>
  <li>If pods don’t come up correctly (e.g., CrashLoopBackOff), you may need to:
    <ul>
      <li>Reapply deploy-all.sh</li>
      <li>
        <p>Re-check Minikube disk availability with:</p>

        <div class="language-bash highlighter-rouge"><div class="highlight"><pre class="highlight"><code>minikube ssh
<span class="nb">df</span> <span class="nt">-h</span>
</code></pre></div>        </div>
      </li>
    </ul>
  </li>
</ul>

<h3 id="-persistent-volumes--restarting-notes">🔒 Persistent Volumes &amp; Restarting Notes</h3>

<table>
  <thead>
    <tr>
      <th>Component</th>
      <th>Persistent?</th>
      <th>How It’s Stored</th>
      <th>Notes</th>
    </tr>
  </thead>
  <tbody>
    <tr>
      <td>Prometheus</td>
      <td>✅</td>
      <td>PVC → HostPath on VM</td>
      <td>Config &amp; scraped metrics preserved across reboots</td>
    </tr>
    <tr>
      <td>Grafana</td>
      <td>✅</td>
      <td>PVC (grafana-pvc)</td>
      <td>Dashboards, settings are saved</td>
    </tr>
    <tr>
      <td>Kafka</td>
      <td>✅</td>
      <td>PVC per broker/controller</td>
      <td>Topic data survives restart. Must wait for all brokers to rejoin.</td>
    </tr>
    <tr>
      <td>Kafka-UI</td>
      <td>❌</td>
      <td>Ephemeral</td>
      <td>Will restart fresh; doesn’t affect Kafka state</td>
    </tr>
  </tbody>
</table>

<h3 id="-optional-restart-deploy-allsh-if-needed">🔁 Optional: Restart deploy-all.sh (if needed)</h3>

<ul>
  <li>You can safely re-run the script to reapply Helm charts and PVCs:
    <ul>
      <li>💡 Helm is idempotent — it will upgrade existing releases without data loss if PVCs exist.</li>
    </ul>
  </li>
</ul>

<div class="language-bash highlighter-rouge"><div class="highlight"><pre class="highlight"><code>./deploy-all.sh
</code></pre></div></div>

<h3 id="-tip-back-up-persistent-data-optional">📁 Tip: Back Up Persistent Data (Optional)</h3>

<ul>
  <li>To snapshot your PVCs before restarting or for backup purposes:</li>
</ul>

<div class="language-bash highlighter-rouge"><div class="highlight"><pre class="highlight"><code>kubectl get pvc <span class="nt">-n</span> monitoring
</code></pre></div></div>

<ul>
  <li>For example:</li>
</ul>

<div class="language-bash highlighter-rouge"><div class="highlight"><pre class="highlight"><code>kubectl <span class="nb">cp </span>monitoring/prometheus-server-0:/opt/bitnami/prometheus/data ./backup-prometheus-data
</code></pre></div></div>

<h2 id="-final-tip-automate-health-checks-optional">🧠 Final Tip: Automate Health Checks (Optional)</h2>

<p>To quickly check if your monitoring stack is up and running, you can either:</p>

<h3 id="-option-a-use-the-health-check-script-recommended"><strong><em>✅ Option A: Use the health check script (recommended)</em></strong></h3>

<ul>
  <li>Run the provided script to verify key components like Prometheus, Grafana, Kafka and Kafka-UI:</li>
</ul>

<div class="language-bash highlighter-rouge"><div class="highlight"><pre class="highlight"><code>./check-health.sh
</code></pre></div></div>

<ul>
  <li>Response</li>
</ul>

<div class="language-bash highlighter-rouge"><div class="highlight"><pre class="highlight"><code>❯ ./check-health.sh

⏳ Checking health of monitoring components <span class="k">in </span>namespace: monitoring
🔍 prometheus-server...
deployment <span class="s2">"prometheus-server"</span> successfully rolled out
✅ prometheus-server is healthy
🔍 grafana...
deployment <span class="s2">"grafana"</span> successfully rolled out
✅ grafana is healthy
🔍 kafka-ui...
deployment <span class="s2">"kafka-ui"</span> successfully rolled out
✅ kafka-ui is healthy
🔍 kafka-controller...
statefulset rolling update <span class="nb">complete </span>3 pods at revision kafka-controller-98bc6557b...
✅ kafka-controller is healthy
✅ Health check completed.
</code></pre></div></div>

<ul>
  <li>If components are not found or in a bad state, the script will print warnings accordingly.</li>
  <li>You can edit the script to match the names of your deployments or statefulsets, depending on your YAMLs.</li>
</ul>

<h3 id="-option-b-check-manually-with-kubectl"><strong><em>🔍 Option B: Check manually with kubectl</em></strong></h3>

<p>If you prefer manual inspection or want to verify specific resources:</p>

<ul>
  <li>List all pods in the monitoring namespace:</li>
</ul>

<div class="language-bash highlighter-rouge"><div class="highlight"><pre class="highlight"><code>kubectl get pods <span class="nt">-n</span> monitoring
</code></pre></div></div>

<ul>
  <li>You should see something like:</li>
</ul>

<div class="language-bash highlighter-rouge"><div class="highlight"><pre class="highlight"><code>NAME                                                READY   STATUS    RESTARTS        AGE
grafana-57554dd88-rc8z4                             1/1     Running   0               3h11m
kafka-controller-0                                  1/1     Running   0               175m
kafka-controller-1                                  1/1     Running   0               175m
kafka-controller-2                                  1/1     Running   0               175m
kafka-ui-5448964747-ds2bd                           1/1     Running   0               171m
prometheus-alertmanager-0                           1/1     Running   1 <span class="o">(</span>4h59m ago<span class="o">)</span>   24h
prometheus-kube-state-metrics-7f796b7d44-89mjd      1/1     Running   1 <span class="o">(</span>4h59m ago<span class="o">)</span>   24h
prometheus-prometheus-node-exporter-cltc4           1/1     Running   1 <span class="o">(</span>4h59m ago<span class="o">)</span>   24h
prometheus-prometheus-pushgateway-d4f8cb767-nwtn9   1/1     Running   1 <span class="o">(</span>4h59m ago<span class="o">)</span>   24h
prometheus-server-79798b4ff6-7g55g                  2/2     Running   2 <span class="o">(</span>4h59m ago<span class="o">)</span>   24h
...
</code></pre></div></div>

<ul>
  <li>Check services and their ports:</li>
</ul>

<div class="language-bash highlighter-rouge"><div class="highlight"><pre class="highlight"><code>kubectl get svc <span class="nt">-n</span> monitoring
</code></pre></div></div>

<ul>
  <li>Look for NodePort services exposing the UIs:</li>
</ul>

<div class="language-bash highlighter-rouge"><div class="highlight"><pre class="highlight"><code>NAME                                  TYPE        CLUSTER-IP       EXTERNAL-IP    PORT<span class="o">(</span>S<span class="o">)</span>                      AGE
grafana                               NodePort    10.104.174.27    &lt;none&gt;         80:30095/TCP                 3h11m
kafka                                 ClusterIP   10.106.201.77    &lt;none&gt;         9092/TCP,9095/TCP            175m
kafka-controller-0-external           NodePort    10.105.143.201   192.168.49.2   9094:30092/TCP               175m
kafka-controller-1-external           NodePort    10.101.82.105    192.168.49.2   9094:30093/TCP               175m
kafka-controller-2-external           NodePort    10.97.107.152    192.168.49.2   9094:30094/TCP               175m
kafka-controller-headless             ClusterIP   None             &lt;none&gt;         9094/TCP,9092/TCP,9093/TCP   175m
kafka-ui                              NodePort    10.100.56.227    &lt;none&gt;         8080:30096/TCP               171m
prometheus-alertmanager               ClusterIP   10.103.180.130   &lt;none&gt;         9093/TCP                     24h
prometheus-alertmanager-headless      ClusterIP   None             &lt;none&gt;         9093/TCP                     24h
prometheus-kube-state-metrics         ClusterIP   10.102.171.116   &lt;none&gt;         8080/TCP                     24h
prometheus-prometheus-node-exporter   ClusterIP   10.97.14.115     &lt;none&gt;         9100/TCP                     24h
prometheus-prometheus-pushgateway     ClusterIP   10.101.189.12    &lt;none&gt;         9091/TCP                     24h
prometheus-server                     NodePort    10.104.67.195    &lt;none&gt;         80:30090/TCP                 24h
</code></pre></div></div>

<ul>
  <li>Then, access the dashboards using <code class="language-plaintext highlighter-rouge">http://&lt;minikube-ip&gt;:&lt;nodeport&gt;</code>. For example:
    <ul>
      <li>Grafana: <a href="http://localhost:30095">http://localhost:30095</a></li>
      <li>Prometheus: <a href="http://localhost:30090">http://localhost:30090</a></li>
      <li>Kafka UI: <a href="http://localhost:30096">http://localhost:30096</a></li>
    </ul>
  </li>
  <li><strong>Use minikube ip to get your cluster IP if needed.</strong></li>
</ul>]]></content><author><name>Leoncio López</name><email>leobip27@gmail.com</email></author><category term="devops" /><category term="kubernetes" /><category term="prometheus" /><category term="grafana" /><category term="kafka" /><category term="helm" /><category term="monitoring" /><summary type="html"><![CDATA[📡 Local Monitoring Stack for Kubernetes (Prometheus + Grafana + Kafka)]]></summary></entry><entry><title type="html">🌳 Branching Model &amp;amp; 📌 Semantic Versioning in Git Workflows</title><link href="https://leobip.github.io/git/cicd/versioning/semantic-versioning/" rel="alternate" type="text/html" title="🌳 Branching Model &amp;amp; 📌 Semantic Versioning in Git Workflows" /><published>2025-04-25T19:30:00+02:00</published><updated>2025-04-25T19:30:00+02:00</updated><id>https://leobip.github.io/git/cicd/versioning/semantic-versioning</id><content type="html" xml:base="https://leobip.github.io/git/cicd/versioning/semantic-versioning/"><![CDATA[<p>Managing branches and releases efficiently is crucial for maintaining <strong>code quality, traceability, and smooth deployments</strong>. In this article, we’ll explain how to structure your Git workflow using <strong>branches for different purposes</strong> and how to apply <strong>Semantic Versioning (SemVer)</strong> to tag releases.</p>

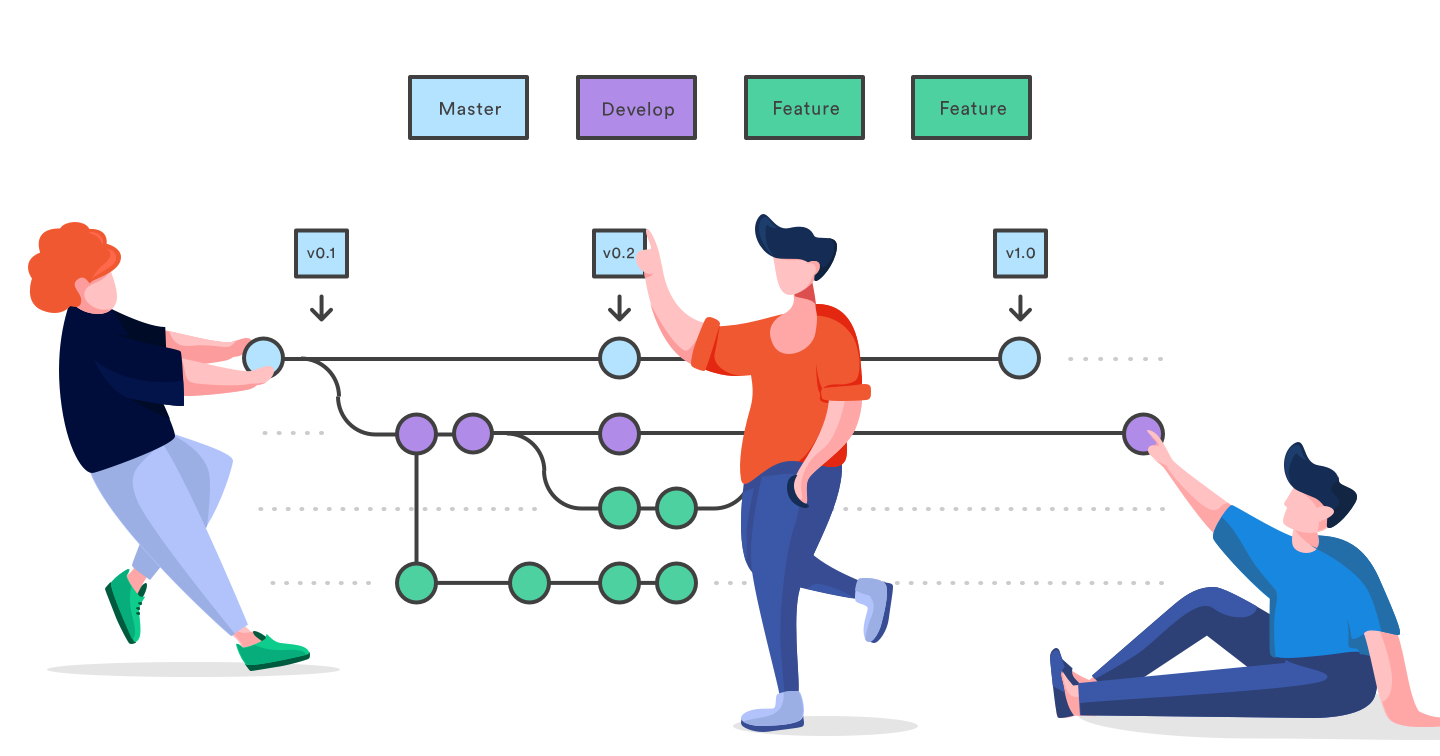
<figure style="display: flex; flex-direction: column; align-items: center;">
  <img src="/assets/images/semantic-versioning-banner.jpeg" style="max-width:100%; height:auto;" />
  <figcaption style="margin-top: 0.5em; font-style: italic;">
  </figcaption>
</figure>

<h2 id="-branching-strategy">🌳 Branching Strategy</h2>

<p>We adopt a simplified <strong>Git Flow–inspired model</strong>:</p>

<ul>
  <li><strong><code class="language-plaintext highlighter-rouge">main</code> branch</strong> → Always reflects the latest <strong>stable production-ready code</strong>.</li>
  <li><strong><code class="language-plaintext highlighter-rouge">dev</code> branch</strong> → Integration branch for ongoing development.</li>
  <li><strong><code class="language-plaintext highlighter-rouge">feature/*</code> branches</strong> → Temporary branches for new features, merged back into <code class="language-plaintext highlighter-rouge">dev</code>.</li>
  <li><strong><code class="language-plaintext highlighter-rouge">hotfix/*</code> branches</strong> → For urgent fixes, branched directly from <code class="language-plaintext highlighter-rouge">main</code>, then merged back into both <code class="language-plaintext highlighter-rouge">main</code> and <code class="language-plaintext highlighter-rouge">dev</code>.</li>
</ul>

<h3 id="example-workflow">Example Workflow</h3>

<pre><code class="language-mermaid">gitGraph
   commit id: "Init"
   branch dev
   checkout dev
   commit id: "Feature A start"
   branch feature/A
   commit id: "WIP A1"
   commit id: "WIP A2"
   checkout dev
   merge feature/A id: "Merge A"
   commit id: "Stabilization"
   checkout main
   merge dev id: "Release v1.0.0"
   branch hotfix/urgent
   commit id: "Hotfix"
   checkout main
   merge hotfix/urgent id: "Release v1.0.1"
   checkout dev
   merge hotfix/urgent

## 📌 Semantic Versioning (SemVer)

We use Semantic Versioning 2.0.0 format:

```bash
MAJOR.MINOR.PATCH
</code></pre>

<ul>
  <li>MAJOR → Breaking changes (e.g., API change, backward-incompatible refactor).</li>
  <li>MINOR → New features, backward-compatible.</li>
  <li>PATCH → Bug fixes, backward-compatible.</li>
</ul>

<h3 id="examples">Examples</h3>

<ul>
  <li>1.0.0 → Initial stable release.</li>
  <li>1.1.0 → Adds new features without breaking existing functionality.</li>
  <li>1.1.1 → Fixes a bug without changing functionality.</li>
</ul>

<h2 id="-tagging-releases-in-git">🏷 Tagging Releases in Git</h2>

<p>Each release is tagged with its SemVer version:</p>

<div class="language-bash highlighter-rouge"><div class="highlight"><pre class="highlight"><code><span class="c"># Tagging a release</span>
git tag <span class="nt">-a</span> v1.0.0 <span class="nt">-m</span> <span class="s2">"Release v1.0.0 - Initial stable release"</span>
git push origin v1.0.0
</code></pre></div></div>

<p>This allows:</p>

<ul>
  <li>CI/CD pipelines to build artifacts based on tags.</li>
  <li>Traceability of deployments.</li>
  <li>Easy rollback to previous versions.</li>
</ul>

<hr />

<h2 id="-integration-with-cicd">🔗 Integration with CI/CD</h2>

<ul>
  <li>Development branch (dev) → triggers tests &amp; static analysis (e.g., SonarQube).</li>
  <li>Main branch (main) → triggers build + deployment pipeline.</li>
  <li>Tags (vX.Y.Z) → trigger release pipelines (e.g., publishing Docker images, Helm charts).</li>
</ul>

<hr />

<h3 id="-conclusion">✅ Conclusion</h3>

<p>By combining a clear branching strategy with Semantic Versioning, we ensure:</p>

<ul>
  <li>Predictable release cycles.</li>
  <li>Traceability of features and fixes.</li>
  <li>Alignment between Git workflow and CI/CD pipelines.</li>
</ul>

<p>This model scales from small projects to enterprise environments and integrates seamlessly with tools like SonarQube, GitHub Actions, and ArgoCD.</p>]]></content><author><name>Leoncio López</name><email>leobip27@gmail.com</email></author><category term="git" /><category term="cicd" /><category term="versioning" /><category term="branching" /><category term="git-flow" /><category term="semantic-versioning" /><summary type="html"><![CDATA[Managing branches and releases efficiently is crucial for maintaining code quality, traceability, and smooth deployments. In this article, we’ll explain how to structure your Git workflow using branches for different purposes and how to apply Semantic Versioning (SemVer) to tag releases.]]></summary></entry><entry><title type="html">⚙️💻 Building a Local Development, Testing &amp;amp; Deployment Environment</title><link href="https://leobip.github.io/devops/tools/local-dev-env/" rel="alternate" type="text/html" title="⚙️💻 Building a Local Development, Testing &amp;amp; Deployment Environment" /><published>2025-04-20T21:55:15+02:00</published><updated>2025-04-20T21:55:15+02:00</updated><id>https://leobip.github.io/devops/tools/local-dev-env</id><content type="html" xml:base="https://leobip.github.io/devops/tools/local-dev-env/"><![CDATA[<p>A well-structured <strong>local development environment</strong> is essential for improving code quality, automating testing, and streamlining deployments.<br />
In this guide, we will progressively build a <strong>local ecosystem</strong> for developers, adding essential tools step by step. The final goal is to create an environment that allows you to <strong>write, analyze, test, and deploy code efficiently</strong>.</p>

<figure style="display: flex; flex-direction: column; align-items: center;">
  <img src="/assets/images/local-dev-env-banner.webp" style="max-width:75%; height:auto;" />
  <figcaption style="margin-top: 0.5em; font-style: italic;">
  </figcaption>
</figure>

<p>This article serves as the <strong>central hub</strong> of the series — each tool (e.g., SonarQube, ArgoCD, Monitoring) will have its own dedicated post with installation details, while here we’ll explain <strong>how everything integrates together</strong>.</p>

<hr />

<h2 id="-planned-components">🗂 Planned Components</h2>

<ul>
  <li><strong>🔍 Code Analysis (SonarQube)</strong> – Static code analysis for code quality.</li>
  <li><strong>📝 Linting (SonarLint for IDEs)</strong> – Consistent coding standards in real-time.</li>
  <li><strong>🔄 Version Control (GitHub)</strong> – Branches, PRs, tags, semantic versioning (we’ll link a dedicated article).</li>
  <li><strong>⚡ CI/CD Pipelines (GitHub Actions)</strong> – Automated build &amp; test pipelines.</li>
  <li><strong>🚀 Deployment (ArgoCD)</strong> – GitOps-based application delivery.</li>
  <li><strong>📊 Monitoring (Prometheus, Grafana)</strong> – Observability for apps.</li>
</ul>

<hr />

<h2 id="-project-structure">📂 Project Structure</h2>

<p>Here’s the proposed folder layout for our environment:</p>

<div class="language-bash highlighter-rouge"><div class="highlight"><pre class="highlight"><code>local-dev-environment/
│
├── sonarqube/                  <span class="c"># SonarQube setup and configuration</span>
│   ├── conf/                   <span class="c"># SonarQube config (sonar.properties, etc.)</span>
│   ├── data/                   <span class="c"># Persistent data storage</span>
│   ├── logs/                   <span class="c"># Log files</span>
│   └── extensions/             <span class="c"># Plugins &amp; extensions</span>
│
├── code-examples/              <span class="c"># Sample code for analysis &amp; testing</span>
│   └── python/
│       └── api-requests.py
│
├── tests/                      <span class="c"># Example unit tests</span>
│   └── test_example.py
│
├── .github/
│   ├── workflows/
│   │   └── sonarqube-analysis.yml  <span class="c"># Pipeline  </span>
│   └── actions-runner/             <span class="c"># Self-hosted GitHub Actions Runner</span>
│       └── run.sh                  <span class="c"># Script to start the runner</span>
│
├── docker-compose.yaml         <span class="c"># Compose file for multiple services</span>
├── README.md                   <span class="c"># Project documentation</span>
└── requirements.txt            <span class="c"># Dependencies</span>
...
... <span class="o">(</span><span class="k">in </span>development<span class="o">)</span>

</code></pre></div></div>

<h3 id="steps">Steps</h3>

<ul>
  <li>Create the folders and initialize the repository</li>
  <li>You can initialize the repository by running git init in the root folder of local-dev-environment.</li>
  <li>Push the code to your GitHub repository and link it here: <a href="https://github.com/leobip/local-dev-env.git">Project GitHub Repository</a></li>
</ul>

<p>This guide will start with SonarQube, a powerful tool for static code analysis, and expand as we integrate more tools.</p>

<h2 id="-static-code-analysis-with-sonarqube">🔍 Static Code Analysis with SonarQube</h2>

<p>We start our environment with SonarQube, a powerful static analysis tool that detects bugs, security vulnerabilities, and code smells.</p>

<p>Once SonarQube is running locally (via docker-compose), we can integrate it into our pipeline so that every push to the repository gets analyzed automatically.</p>

<ul>
  <li>👉 Detailed installation guide: <a href="/tools/code-quality/local-env-sonarqube/">SonarQube Setup Article</a></li>
</ul>

<h2 id="-github-actions--sonarqube-analysis-pipeline">⚡ GitHub Actions – SonarQube Analysis Pipeline</h2>

<p>As a first CI/CD integration, let’s configure a GitHub Actions workflow to run SonarQube scans on our code.
This pipeline runs on the dev branch — a common branching strategy where:</p>

<ul>
  <li>dev → integration branch for ongoing development</li>
  <li>main → stable production-ready branch</li>
  <li>feature/* → temporary branches for new features</li>
</ul>

<p>We’ll create a separate article on branching models, semantic versioning, and release workflows (to keep this guide focused).</p>

<ul>
  <li>👉 Detailed installation guide: <a href="/git/cicd/versioning/semantic-versioning/">Branching &amp; Semantic Versioning Article</a></li>
</ul>

<hr />

<h3 id="-setting-up-github-actions">🔧 Setting Up GitHub Actions</h3>

<ol>
  <li>Navigate to your repository on GitHub.</li>
  <li>Click on the <strong>Actions</strong> tab in the repository menu.</li>
  <li>If this is your first time, you’ll be prompted to configure a new workflow. Click <strong>“Set up this workflow yourself”</strong>.</li>
  <li>GitHub will open a YAML editor where you can define your first workflow.</li>
  <li>
    <p>Inside your repository, make sure you have the following directory structure:</p>

    <div class="language-bash highlighter-rouge"><div class="highlight"><pre class="highlight"><code>.github/
  └── workflows/
      └── sonarqube-analysis.yml
</code></pre></div>    </div>
  </li>
</ol>

<p>This file will contain the pipeline configuration for SonarQube analysis.</p>

<h3 id="-add-sonarqube-token-to-github-secrets">🔑 Add SonarQube Token to GitHub Secrets</h3>

<p>For the workflow to authenticate with SonarQube, you need a token:</p>

<ul>
  <li>Generate a token in SonarQube:
    <ul>
      <li>Go to My Account → Security → Generate Tokens.</li>
      <li>Copy the generated token (you will not be able to see it again).</li>
    </ul>
  </li>
  <li>Add it to your GitHub repository secrets:
    <ul>
      <li>Open your GitHub repository.</li>
      <li>Go to Settings → Secrets and variables → Actions.</li>
      <li>Click New repository secret.</li>
      <li>Name it SONAR_TOKEN and paste the value from SonarQube.</li>
    </ul>
  </li>
  <li>Workflow File: .github/workflows/sonarqube-analysis.yml</li>
</ul>

<div class="language-yaml highlighter-rouge"><div class="highlight"><pre class="highlight"><code><span class="na">name</span><span class="pi">:</span> <span class="s">SonarQube Analysis</span>

<span class="na">on</span><span class="pi">:</span>
  <span class="na">push</span><span class="pi">:</span>
    <span class="na">branches</span><span class="pi">:</span>
      <span class="pi">-</span> <span class="s">dev</span>
  <span class="c1"># Uncomment below if you want to analyze PRs into main</span>
  <span class="c1"># pull_request:</span>
  <span class="c1">#   branches:</span>
  <span class="c1">#     - main</span>

<span class="na">jobs</span><span class="pi">:</span>
  <span class="na">sonarQube</span><span class="pi">:</span>
    <span class="na">runs-on</span><span class="pi">:</span> <span class="s">self-hosted</span>

    <span class="na">steps</span><span class="pi">:</span>
      <span class="pi">-</span> <span class="na">name</span><span class="pi">:</span> <span class="s">Checkout code</span>
        <span class="na">uses</span><span class="pi">:</span> <span class="s">actions/checkout@v4</span>

      <span class="pi">-</span> <span class="na">name</span><span class="pi">:</span> <span class="s">Run SonarScanner</span>
        <span class="na">run</span><span class="pi">:</span> <span class="pi">|</span>
          <span class="s">sonar-scanner \</span>
            <span class="s">-Dsonar.projectKey=chronos-desktop-app \</span>
            <span class="s">-Dsonar.sources=. \</span>
            <span class="s">-Dsonar.host.url=http://localhost:9001 \</span>
            <span class="s">-Dsonar.login=$</span>
</code></pre></div></div>

<h2 id="️-setting-up-the-actions-runner">🖥️ Setting Up the Actions Runner</h2>

<p>Since we’re running SonarQube locally, the pipeline needs a self-hosted GitHub Actions runner.</p>

<h3 id="steps-to-add-actions-runner">Steps to Add Actions Runner</h3>

<ul>
  <li>Create the folder:</li>
</ul>

<div class="language-bash highlighter-rouge"><div class="highlight"><pre class="highlight"><code><span class="nb">mkdir</span> <span class="nt">-p</span> .github/actions-runner
</code></pre></div></div>

<ul>
  <li>Inside, add the script run.sh:</li>
</ul>

<div class="language-bash highlighter-rouge"><div class="highlight"><pre class="highlight"><code><span class="c">#!/bin/bash</span>
<span class="nb">cd</span> .github/actions-runner
./run.sh

<span class="c"># Make it executable:</span>
<span class="nb">chmod</span> +x .github/actions-runner/run.sh

<span class="c"># Start the runner before pushing code:</span>
./github/actions-runner/run.sh
</code></pre></div></div>

<h3 id="️-important-notes">⚠️ Important Notes</h3>

<p>✅ SonarQube must be running → Since we deployed it via Docker Compose, containers will auto-restart after a reboot (unless stopped manually in Docker Desktop). You can always check in Docker Desktop or via docker ps.</p>

<p>✅ Start the runner before committing/pushing → If the runner isn’t running, GitHub won’t detect the workflow and the pipeline won’t execute.</p>

<p>✅ Branch strategy → For now, we trigger analysis only on dev. Later, we’ll extend this to main and release workflows.</p>

<h3 id="-key-points">🔑 Key Points</h3>

<ul>
  <li>runs-on: self-hosted → The job runs on a self-hosted runner (needed since we use local SonarQube).</li>
  <li>SONAR_TOKEN → Stored in GitHub Secrets, generated from SonarQube.</li>
  <li>Branching strategy → For now, we run scans on dev. Later, we may extend it to main or PRs.</li>
</ul>

<p>This ensures every code change on dev is scanned, keeping quality checks aligned with our development workflow.</p>

<h2 id="-next-steps">🚀 Next Steps</h2>

<ul>
  <li>Expand pipelines to include tests, builds, and deployments.</li>
  <li>Add ArgoCD to migrate and manage SonarQube in Kubernetes.</li>
  <li>Extend analysis pipelines for main branch with semantic versioning &amp; release tags.</li>
  <li>Integrate monitoring to visualize the health of our apps.</li>
</ul>

<p>This is just the first building block of our developer ecosystem. With each article, we’ll add another piece until the full puzzle comes together. 🧩</p>]]></content><author><name>Leoncio López</name><email>leobip27@gmail.com</email></author><category term="devops" /><category term="tools" /><category term="cicd" /><category term="docker" /><category term="sonarqube" /><category term="local-environment" /><summary type="html"><![CDATA[A well-structured local development environment is essential for improving code quality, automating testing, and streamlining deployments. In this guide, we will progressively build a local ecosystem for developers, adding essential tools step by step. The final goal is to create an environment that allows you to write, analyze, test, and deploy code efficiently.]]></summary></entry><entry><title type="html">🐍 PYTHON - Tools Library</title><link href="https://leobip.github.io/python/tools/python-library/" rel="alternate" type="text/html" title="🐍 PYTHON - Tools Library" /><published>2024-12-10T00:00:00+01:00</published><updated>2024-12-10T00:00:00+01:00</updated><id>https://leobip.github.io/python/tools/python-library</id><content type="html" xml:base="https://leobip.github.io/python/tools/python-library/"><![CDATA[<figure style="display: flex; flex-direction: column; align-items: center;">
  <img src="/assets/images/2024-12-10-python-library.png" style="max-width:100%; height:auto;" />
  <figcaption style="margin-top: 0.5em; font-style: italic;">
  </figcaption>
</figure>

<h2 id="introduction">Introduction</h2>

<p>In this post, <strong>Python Tools Library</strong>, I’ll be collecting and sharing tools that I’ve developed to make my day-to-day work easier, cover specific needs, or simply explore ideas that might simplify common tasks.</p>

<p>The goal is to share knowledge in a practical way. All tools will be stored in the <strong>same GitHub repository</strong>, and the blog will indicate which tool was added most recently so readers can easily track updates.</p>

<hr />

<h2 id="json-full-search">JSon Full Search</h2>

<figure style="display: flex; flex-direction: column; align-items: center;">
  <img src="/assets/images/2024-12-10-python-json-small.webp" style="max-width:60%; height:auto;" />
  <figcaption style="margin-top: 0.5em; font-style: italic;">
    Image generated with AI (custom design).
  </figcaption>
</figure>

<h3 id="description">Description</h3>

<p>As the name suggests, this is a function designed to parse a JSON file and extract the value of a given key. It works recursively, which means it can traverse nested dictionaries and retrieve either a single value or an entire dictionary depending on the requested key.</p>

<p>This makes it especially useful when working with deeply nested JSON structures. Here I’ll explain how to use it and document future improvements.</p>

<h3 id="example-json">Example JSON</h3>

<div class="language-json highlighter-rouge"><div class="highlight"><pre class="highlight"><code><span class="w">
</span><span class="p">{</span><span class="w">
    </span><span class="nl">"name"</span><span class="p">:</span><span class="w"> </span><span class="s2">"John Doe"</span><span class="p">,</span><span class="w">
    </span><span class="nl">"age"</span><span class="p">:</span><span class="w"> </span><span class="mi">30</span><span class="p">,</span><span class="w">
    </span><span class="nl">"address"</span><span class="p">:</span><span class="w"> </span><span class="p">{</span><span class="w">
        </span><span class="nl">"street"</span><span class="p">:</span><span class="w"> </span><span class="s2">"123 Main St"</span><span class="p">,</span><span class="w">
        </span><span class="nl">"city"</span><span class="p">:</span><span class="w"> </span><span class="s2">"Anytown"</span><span class="p">,</span><span class="w">
        </span><span class="nl">"state"</span><span class="p">:</span><span class="w"> </span><span class="s2">"CA"</span><span class="p">,</span><span class="w">
        </span><span class="nl">"country"</span><span class="p">:</span><span class="w"> </span><span class="p">{</span><span class="w">
            </span><span class="nl">"name"</span><span class="p">:</span><span class="w"> </span><span class="s2">"United States"</span><span class="p">,</span><span class="w">
            </span><span class="nl">"code"</span><span class="p">:</span><span class="w"> </span><span class="s2">"US"</span><span class="w">
        </span><span class="p">}</span><span class="w">
    </span><span class="p">},</span><span class="w">
    </span><span class="nl">"email"</span><span class="p">:</span><span class="w"> </span><span class="s2">"john.doe@example.com"</span><span class="p">,</span><span class="w">
    </span><span class="nl">"phone_numbers"</span><span class="p">:</span><span class="w"> </span><span class="p">[</span><span class="w">
        </span><span class="p">{</span><span class="w">
            </span><span class="nl">"type"</span><span class="p">:</span><span class="w"> </span><span class="s2">"home"</span><span class="p">,</span><span class="w">
            </span><span class="nl">"number"</span><span class="p">:</span><span class="w"> </span><span class="s2">"555-555-5555"</span><span class="w">
        </span><span class="p">},</span><span class="w">
        </span><span class="p">{</span><span class="w">
            </span><span class="nl">"type"</span><span class="p">:</span><span class="w"> </span><span class="s2">"work"</span><span class="p">,</span><span class="w">
            </span><span class="nl">"number"</span><span class="p">:</span><span class="w"> </span><span class="s2">"555-555-5556"</span><span class="w">
        </span><span class="p">}</span><span class="w">
    </span><span class="p">],</span><span class="w">
    </span><span class="nl">"employment"</span><span class="p">:</span><span class="w"> </span><span class="p">{</span><span class="w">
        </span><span class="nl">"job_title"</span><span class="p">:</span><span class="w"> </span><span class="s2">"Software Engineer"</span><span class="p">,</span><span class="w">
        </span><span class="nl">"department"</span><span class="p">:</span><span class="w"> </span><span class="p">{</span><span class="w">
            </span><span class="nl">"name"</span><span class="p">:</span><span class="w"> </span><span class="s2">"Engineering"</span><span class="p">,</span><span class="w">
            </span><span class="nl">"location"</span><span class="p">:</span><span class="w"> </span><span class="p">{</span><span class="w">
                </span><span class="nl">"building"</span><span class="p">:</span><span class="w"> </span><span class="s2">"HQ"</span><span class="p">,</span><span class="w">
                </span><span class="nl">"floor"</span><span class="p">:</span><span class="w"> </span><span class="mi">5</span><span class="w">
            </span><span class="p">}</span><span class="w">
        </span><span class="p">}</span><span class="w">
    </span><span class="p">}</span><span class="w">
</span><span class="p">}</span><span class="w">

</span></code></pre></div></div>

<h3 id="usage">Usage</h3>

<p>From the example above, you can extract the value of the key city: “Anytown”.
You can also extract the full nested dictionary address: { … }.</p>

<h3 id="pending-features">Pending features</h3>

<ul>
  <li>Counter for cases with duplicate keys (e.g., multiple name fields).</li>
  <li>Key identifiers to handle repeated keys.</li>
</ul>

<h3 id="features">Features</h3>

<ul>
  <li><strong>Tecnology:</strong> Python</li>
</ul>

<p>🔗 GitHub Repository: <a href="https://github.com/leobip/python-custom-tools.git">python-custom-tools</a></p>]]></content><author><name>Leoncio López</name><email>leobip27@gmail.com</email></author><category term="python" /><category term="tools" /><category term="python" /><category term="libraries" /><category term="reference" /><summary type="html"><![CDATA[]]></summary></entry><entry><title type="html">🔍 SonarQube / SonarLint - Install, Config &amp;amp; Analysis</title><link href="https://leobip.github.io/tools/code-quality/local-env-sonarqube/" rel="alternate" type="text/html" title="🔍 SonarQube / SonarLint - Install, Config &amp;amp; Analysis" /><published>2024-10-20T21:55:15+02:00</published><updated>2024-10-20T21:55:15+02:00</updated><id>https://leobip.github.io/tools/code-quality/local-env-sonarqube</id><content type="html" xml:base="https://leobip.github.io/tools/code-quality/local-env-sonarqube/"><![CDATA[<p>In this article, we will explore SonarQube and SonarLint, key tools for improving code quality. SonarQube acts as a central server for static code analysis, while SonarLint provides real-time feedback in the development environment. Additionally, we will see how to integrate them to maximize their effectiveness.</p>

<hr />

<figure style="display: flex; flex-direction: column; align-items: center;">
  <img src="/assets/images/2025-03-20-sonarqube-share.png" style="max-width:100%; height:auto;" />
  <figcaption style="margin-top: 0.5em; font-style: italic;">
  </figcaption>
</figure>

<h1 id="-sonarqube--sonarlint"><img src="/assets/images/2025-03-20-sonarqube-intensifies.gif" alt="SonarQube" width="40" style="vertical-align: middle;" /> SonarQube &amp; SonarLint</h1>

<h3 id="repository-reference">Repository Reference</h3>

<p>All the configuration files, including the <code class="language-plaintext highlighter-rouge">docker-compose.yaml</code> used in this article, are available in our repository:</p>

<p>👉 <a href="https://github.com/leobip/local-dev-env">local-dev-env Repository</a></p>

<p>This repository is intended to become the central place for our <strong>local development environment setup</strong>, where we will keep adding tools such as:</p>

<ul>
  <li><strong>SonarQube</strong> – Static code analysis (this article).</li>
  <li><strong>GitHub Actions Pipelines</strong> – CI/CD workflows.</li>
  <li><strong>ArgoCD</strong> – GitOps-based application deployment.</li>
  <li><strong>Monitoring stack</strong> – Observability for apps.</li>
  <li>And more developer tools…</li>
</ul>

<p>Each tool will have its <strong>own dedicated article</strong> with installation details, and the <strong>central article</strong> <code class="language-plaintext highlighter-rouge">Local Dev Environment</code> will explain how they all integrate together into a complete workflow.</p>

<h3 id="what-is-sonarqube">What is SonarQube?</h3>

<p><a href="https://www.sonarqube.org/">SonarQube</a> is a powerful static code analysis tool that helps developers identify bugs, security vulnerabilities, and code smells in their projects. It provides detailed insights to improve code quality and maintainability.</p>

<p>SonarQube is available in different editions:</p>

<ul>
  <li><strong>Community Edition</strong> (Free) – Open-source version with essential static analysis features.</li>
  <li><strong>Developer Edition</strong> – Adds advanced language support and branch analysis.</li>
  <li><strong>Enterprise Edition</strong> – Includes portfolio management and governance features.</li>
  <li><strong>Data Center Edition</strong> – High availability and scalability for large teams.</li>
</ul>

<p>For this guide, we will use the <strong>Community Edition</strong>.</p>

<h3 id="what-is-sonarlint">What is SonarLint?</h3>

<p><a href="https://www.sonarlint.org/">SonarLint</a> is an IDE plugin that provides real-time linting and code analysis. It helps developers catch issues early in the development process, ensuring consistent and high-quality code. It can be confiugured to work alone or with connection to SonarQube profiles, It functions as an extension of SonarQube when connected to the server.</p>

<h4 id="connection-between-sonarlint-and-sonarqube">Connection between SonarLint and SonarQube</h4>

<ul>
  <li>SonarLint can operate in two modes:
    <ul>
      <li>Standalone mode: Works independently in the IDE.</li>
      <li>Connected mode: Synchronizes with a SonarQube server to share rules and configurations.</li>
    </ul>
  </li>
  <li>To connect SonarLint with SonarQube:
    <ul>
      <li>Ensure that SonarQube is running.</li>
      <li>Install the SonarLint plugin in your IDE.</li>
      <li>Add the SonarQube URL in the SonarLint configuration.</li>
      <li>Authenticate with a SonarQube token.</li>
    </ul>
  </li>
</ul>

<hr />

<h3 id="database-support-in-sonarqube">Database Support in SonarQube</h3>

<h3 id="embedded-database-h2">Embedded Database (H2)</h3>

<p>By default, SonarQube <strong>Community Edition</strong> comes with an embedded <strong>H2 database</strong>. However, this database is only intended for <strong>evaluation and personal/local usage</strong>, as it is <strong>not recommended for production</strong> due to size &amp; data scalability limitations.</p>

<h3 id="supported-external-databases">Supported External Databases</h3>

<p>For a <strong>stable and production-ready</strong> deployment, SonarQube supports the following databases</p>

<ul>
  <li><strong>PostgreSQL</strong> (Recommended)</li>
  <li><strong>Microsoft SQL Server</strong></li>
  <li><strong>Oracle Database</strong></li>
</ul>

<h4 id="sonarqube-database-configuration-guides">SonarQube Database Configuration Guides</h4>

<ul>
  <li><a href="https://docs.sonarsource.com/sonarqube-server/latest/setup-and-upgrade/install-the-server/installing-the-database/">SonarQube Database Configuration Guide</a></li>
</ul>

<h2 id="installing-sonarqube-locally">Installing SonarQube Locally</h2>

<ul>
  <li>
    <p>Prerequisite:
Before setting up SonarQube, ensure that Docker &amp; docker-compose is installed on your machine. You can find the complete installation guide on the official Docker website, Docker Installation Guide:  https://docs.docker.com/engine/install/</p>
  </li>
  <li>
    <p>SonarQube Installation</p>
  </li>
</ul>

<p>To deploy SonarQube locally, we will use Docker Compose. This approach allows for future integration of additional tools and services within the local development environment. Using Docker Compose simplifies service configuration and management through a docker-compose.yaml file located in the project’s root directory.</p>

<p>Docker significantly simplifies the process of running SonarQube without requiring complex manual configurations.
For reference, the SonarQube page on Docker Hub (https://hub.docker.com/_/sonarqube)  provides links to repositories with example Dockerfile and docker-compose.yaml configurations, and instructions to install and run SonarQube with simplest command like:</p>

<div class="language-yaml highlighter-rouge"><div class="highlight"><pre class="highlight"><code><span class="s">docker run --name sonarqube-custom -p 9000:9000 sonarqube:community</span>
</code></pre></div></div>

<p>You can then browse to http://localhost:9000 or http://host-ip:9000 in your web browser to access the web interface.</p>

<h3 id="bonus-helm---installation-with-postgresql-included">Bonus: <strong>HELM</strong> - Installation with PostgreSQL Included</h3>

<p>For Kubernetes users, SonarQube can be installed using Helm with a <strong>PostgreSQL database included</strong>. Check out the official Helm package:  (here you can find different versions at Artifact Hub)
🔗 <a href="https://artifacthub.io/packages/helm/sonarqube/sonarqube">SonarQube Helm Chart</a></p>

<h3 id="folder-structure">Folder Structure</h3>

<div class="language-bash highlighter-rouge"><div class="highlight"><pre class="highlight"><code>local-dev-environment/
│
├── sonarqube/                  <span class="c"># SonarQube setup</span>
│   ├── conf/                   <span class="c"># Configuration files</span>
│   ├── data/                   <span class="c"># Data storage</span>
│   ├── logs/                   <span class="c"># Log files</span>
│   ├── extensions/             <span class="c"># Plugins and extensions</span>
│
├── docker-compose.yaml         <span class="c"># Docker Compose for multiple services</span>
...
</code></pre></div></div>

<ul>
  <li>docker-compose.yaml (at project root)</li>
</ul>

<div class="language-yaml highlighter-rouge"><div class="highlight"><pre class="highlight"><code><span class="na">services</span><span class="pi">:</span>
  <span class="na">sonarqube</span><span class="pi">:</span>
    <span class="na">image</span><span class="pi">:</span> <span class="s">sonarqube:community</span> <span class="c1"># We are using the latest community version, it could also be the lts-community -(Long Term Support)</span>
    <span class="na">restart</span><span class="pi">:</span> <span class="s">unless-stopped</span>  <span class="c1"># 🔄 Automatically restarts after a system reboot</span>
    <span class="na">depends_on</span><span class="pi">:</span>
      <span class="pi">-</span> <span class="s">sonar_db</span>
    <span class="na">environment</span><span class="pi">:</span>
      <span class="na">SONAR_JDBC_URL</span><span class="pi">:</span> <span class="s">jdbc:postgresql://sonar_db:5432/sonar</span>
      <span class="na">SONAR_JDBC_USERNAME</span><span class="pi">:</span> <span class="s">sonar</span>
      <span class="na">SONAR_JDBC_PASSWORD</span><span class="pi">:</span> <span class="s">sonar</span>
    <span class="na">ports</span><span class="pi">:</span>
      <span class="pi">-</span> <span class="s2">"</span><span class="s">9001:9000"</span>
    <span class="na">volumes</span><span class="pi">:</span>
      <span class="pi">-</span> <span class="s">sonarqube_conf:/opt/sonarqube/conf</span>
      <span class="pi">-</span> <span class="s">sonarqube_data:/opt/sonarqube/data</span>
      <span class="pi">-</span> <span class="s">sonarqube_extensions:/opt/sonarqube/extensions</span>
      <span class="pi">-</span> <span class="s">sonarqube_logs:/opt/sonarqube/logs</span>
      <span class="pi">-</span> <span class="s">sonarqube_temp:/opt/sonarqube/temp</span>

  <span class="na">sonar_db</span><span class="pi">:</span>
    <span class="na">image</span><span class="pi">:</span> <span class="s">postgres:13</span>
    <span class="na">restart</span><span class="pi">:</span> <span class="s">unless-stopped</span>  <span class="c1"># 🔄 Automatically restarts after a system reboot</span>
    <span class="na">environment</span><span class="pi">:</span>
      <span class="na">POSTGRES_USER</span><span class="pi">:</span> <span class="s">sonar</span>
      <span class="na">POSTGRES_PASSWORD</span><span class="pi">:</span> <span class="s">sonar</span>
      <span class="na">POSTGRES_DB</span><span class="pi">:</span> <span class="s">sonar</span>
    <span class="na">volumes</span><span class="pi">:</span>
      <span class="pi">-</span> <span class="s">sonar_db:/var/lib/postgresql</span>
      <span class="pi">-</span> <span class="s">sonar_db_data:/var/lib/postgresql/data</span>

<span class="na">volumes</span><span class="pi">:</span>
  <span class="na">sonarqube_conf</span><span class="pi">:</span>
  <span class="na">sonarqube_data</span><span class="pi">:</span>
  <span class="na">sonarqube_extensions</span><span class="pi">:</span>
  <span class="na">sonarqube_logs</span><span class="pi">:</span>
  <span class="na">sonarqube_temp</span><span class="pi">:</span>
  <span class="na">sonar_db</span><span class="pi">:</span>
  <span class="na">sonar_db_data</span><span class="pi">:</span>

</code></pre></div></div>

<h3 id="automatic-backup-of-the-sonarqube-database-optional">Automatic Backup of the SonarQube Database (Optional)</h3>

<p>Even though we configured restart: unless-stopped, ensuring that data persists after a reboot, in our local environment, it’s good practice to have a backup strategy. Below is a solution using a backup service.</p>

<h4 id="manual-db-backup">Manual DB Backup</h4>

<ul>
  <li>To back up the PostgreSQL database:</li>
</ul>

<div class="language-bash highlighter-rouge"><div class="highlight"><pre class="highlight"><code>docker <span class="nb">exec</span> <span class="nt">-t</span> postgres pg_dumpall <span class="nt">-c</span> <span class="nt">-U</span> sonar <span class="o">&gt;</span> backup.sql
</code></pre></div></div>

<ul>
  <li>To restore:</li>
</ul>

<div class="language-bash highlighter-rouge"><div class="highlight"><pre class="highlight"><code>docker <span class="nb">exec</span> <span class="nt">-i</span> postgres psql <span class="nt">-U</span> sonar <span class="nt">-d</span> sonarqube &lt; backup.sql
</code></pre></div></div>

<h4 id="adding-a-backup-service">Adding a Backup Service</h4>

<ul>
  <li>Add this code to the docker-compose.yaml</li>
</ul>

<div class="language-yaml highlighter-rouge"><div class="highlight"><pre class="highlight"><code>  <span class="na">sonar_backup</span><span class="pi">:</span>
    <span class="na">image</span><span class="pi">:</span> <span class="s">postgres:13</span>
    <span class="na">depends_on</span><span class="pi">:</span>
      <span class="pi">-</span> <span class="s">sonar_db</span>
    <span class="na">volumes</span><span class="pi">:</span>
      <span class="pi">-</span> <span class="s">sonarqube_data:/opt/sonarqube/data</span>
    <span class="na">entrypoint</span><span class="pi">:</span> <span class="pi">[</span><span class="s2">"</span><span class="s">/bin/sh"</span><span class="pi">,</span> <span class="s2">"</span><span class="s">-c"</span><span class="pi">,</span> <span class="s2">"</span><span class="s">while</span><span class="nv"> </span><span class="s">true;</span><span class="nv"> </span><span class="s">do</span><span class="nv"> </span><span class="s">/opt/sonarqube/data/backup_db.sh;</span><span class="nv"> </span><span class="s">sleep</span><span class="nv"> </span><span class="s">86400;</span><span class="nv"> </span><span class="s">done"</span><span class="pi">]</span>
</code></pre></div></div>

<ul>
  <li>Backup Script</li>
</ul>

<p>Create the following script inside sonarqube/data/backup_db.sh:</p>

<div class="language-bash highlighter-rouge"><div class="highlight"><pre class="highlight"><code><span class="c">#!/bin/bash</span>

<span class="c"># Configuration</span>
<span class="nv">BACKUP_DIR</span><span class="o">=</span><span class="s2">"/opt/sonarqube/data/backups"</span>
<span class="nv">TIMESTAMP</span><span class="o">=</span><span class="si">$(</span><span class="nb">date</span> +<span class="s2">"%Y-%m-%d_%H-%M-%S"</span><span class="si">)</span>
<span class="nv">BACKUP_FILE</span><span class="o">=</span><span class="s2">"</span><span class="nv">$BACKUP_DIR</span><span class="s2">/sonarqube_db_</span><span class="nv">$TIMESTAMP</span><span class="s2">.sql"</span>

<span class="c"># Create backup directory if it does not exist</span>
<span class="nb">mkdir</span> <span class="nt">-p</span> <span class="nv">$BACKUP_DIR</span>

<span class="c"># Perform PostgreSQL backup</span>
<span class="nv">PGPASSWORD</span><span class="o">=</span><span class="s2">"sonar"</span> pg_dump <span class="nt">-h</span> sonar_db <span class="nt">-U</span> sonar <span class="nt">-d</span> sonar <span class="o">&gt;</span> <span class="nv">$BACKUP_FILE</span>

<span class="c"># Clean up old backups (optional, keep only the last 5 backups)</span>
<span class="nb">ls</span> <span class="nt">-tp</span> <span class="nv">$BACKUP_DIR</span> | <span class="nb">grep</span> <span class="nt">-v</span> <span class="s1">'/$'</span> | <span class="nb">tail</span> <span class="nt">-n</span> +6 | xargs <span class="nt">-I</span> <span class="o">{}</span> <span class="nb">rm</span> <span class="nt">--</span> <span class="s2">"</span><span class="nv">$BACKUP_DIR</span><span class="s2">/{}"</span>

<span class="nb">echo</span> <span class="s2">"Backup completed: </span><span class="nv">$BACKUP_FILE</span><span class="s2">"</span>
</code></pre></div></div>

<ul>
  <li>Grant Execution Permission</li>
  <li>Run the following command to make the script executable:</li>
</ul>

<div class="language-bash highlighter-rouge"><div class="highlight"><pre class="highlight"><code><span class="nb">chmod</span> +x sonarqube/data/backup_db.sh
</code></pre></div></div>

<h3 id="conclusion">Conclusion</h3>

<ul>
  <li>SonarQube and PostgreSQL are configured with persistent storage.</li>
  <li>Containers automatically restart unless manually stopped.</li>
  <li>A backup service is set up to create database backups automatically.</li>
</ul>

<p>This setup ensures a robust SonarQube environment for local development. 🚀</p>

<h3 id="running-sonarqube">Running SonarQube</h3>

<p>Once the files are in place, follow these steps to start SonarQube:</p>

<ul>
  <li>Build the SonarQube image</li>
</ul>

<div class="language-bash highlighter-rouge"><div class="highlight"><pre class="highlight"><code>docker-compose build

</code></pre></div></div>

<ul>
  <li>Start the SonarQube container</li>
</ul>

<div class="language-bash highlighter-rouge"><div class="highlight"><pre class="highlight"><code>docker-compose up <span class="nt">-d</span>

</code></pre></div></div>

<p><img src="/assets/images/2025-03-20-sonarqube-docker-compose-creation.jpg" alt="compose-creation" /></p>

<ul>
  <li>Access SonarQube UI
    <ul>
      <li>Open http://localhost:9001 in your browser.</li>
      <li><img src="/assets/images/2025-03-20-sonar-login.jpg" alt="sonar-login" /></li>
    </ul>
  </li>
  <li>Login Credentials
    <ul>
      <li>Username: admin</li>
      <li>Password: admin</li>
    </ul>
  </li>
</ul>

<h2 id="installing-and-configuring-sonarqube-for-ide-fromerly-sonarlint">Installing and Configuring SonarQube for IDE (fromerly SonarLint)</h2>

<h3 id="installation">Installation</h3>

<h4 id="to-install-sonarlint-in-your-ide">To install SonarLint in your IDE</h4>

<ul>
  <li>VS Code: Install the “SonarLint” extension from the Extensions Marketplace</li>
  <li>IntelliJ IDEA: Install the “SonarLint” plugin from the Plugins Marketplace.</li>
  <li>Eclipse: Install the “SonarLint” plugin from the Eclipse Marketplace.</li>
</ul>

<p>Vs-Code Example</p>

<ul>
  <li><img src="/assets/images/2025-03-20-sonarlint-install1.jpg" alt="sonar-lint-vscode" /></li>
</ul>

<h5 id="using-sonarlint-in-standalone-mode">Using SonarLint in Standalone Mode</h5>

<p>SonarLint can work independently without connecting to a SonarQube server. In this mode, it provides static analysis using its built-in rule set.</p>

<p>For example, after installing SonarLint in VS Code:</p>

<ul>
  <li>Open a project.
    <ul>
      <li>SonarLint will automatically scan the files for issues.</li>
      <li>Hover over a warning to view explanations and possible fixes.</li>
    </ul>
  </li>
</ul>

<p>This is useful when you want quick feedback without setting up a full SonarQube instance.</p>

<ul>
  <li><img src="/assets/images/2025-03-20-sonarlint-find.png" alt="sonar-lint-find" /></li>
</ul>

<h5 id="configuration-in-connected-mode">Configuration in Connected Mode</h5>

<p>To connect SonarLint to SonarQube:</p>

<p>Open the SonarLint settings in your IDE.</p>

<p>Select “Connect to SonarQube or SonarCloud.”</p>

<p><img src="/assets/images/2025-03-20-sonarqube-ide-config1.jpg" alt="sonarqube-config-1" /></p>

<p>Enter the SonarQube server URL (e.g., http://localhost:9000).</p>

<p><img src="/assets/images/2025-03-20-sonarqube-ide-config2.jpg" alt="sonarqube-config2" /></p>

<p>Authenticate using a SonarQube token. (Or allow access from your Sonarqube instance)</p>

<p><img src="/assets/images/2025-03-20-sonarqube-ide-config3.jpg" alt="sonarqube-config3" /></p>

<hr />

<p><img src="/assets/images/2025-03-20-sonarqube-ide-config4.jpg" alt="sonarqube-config4" /></p>

<p>Select the project to synchronize the analysis rules.</p>

<p>Example of SonarLint in Action</p>

<p>Open a code file in your IDE.</p>

<p>If there are issues, SonarLint will highlight them with warnings and suggestions.</p>

<p>Hover over an issue to see details and possible fixes.</p>

<p>If connected to SonarQube, the rules from the server will be applied in real-time.</p>

<p><strong><em>With this setup, you have a functional SonarQube environment with persistence and an external database. Additionally, SonarLint enhances your development experience by providing real-time feedback. Now it’s time to analyze your code!</em></strong></p>

<h2 id="next-steps">Next Steps</h2>

<p>In this article, we focused on installing and configuring <strong>SonarQube</strong> with Docker Compose.<br />
This is part of a broader series about building a <strong>local development &amp; testing environment</strong>.</p>

<p>In the following articles, we will integrate additional tools such as <strong>GitHub Actions pipelines, ArgoCD, and monitoring solutions</strong>.<br />
When we introduce <strong>ArgoCD</strong>, we will also show how to migrate SonarQube from Docker Compose to Kubernetes and manage it through GitOps.</p>

<p>Stay tuned — our development environment will keep evolving step by step! 🚀</p>]]></content><author><name>Leoncio López</name><email>leobip27@gmail.com</email></author><category term="tools" /><category term="code-quality" /><category term="sonarqube" /><category term="sonarlint" /><category term="static-analysis" /><category term="docker" /><summary type="html"><![CDATA[In this article, we will explore SonarQube and SonarLint, key tools for improving code quality. SonarQube acts as a central server for static code analysis, while SonarLint provides real-time feedback in the development environment. Additionally, we will see how to integrate them to maximize their effectiveness.]]></summary></entry></feed>