
GoWatchTower
📝 GoWatchtower: Kubernetes-native Observability in Go
1. Introduction 🌍
When you run workloads on Kubernetes, you learn one truth very quickly: things break, and they break fast. Pods crash, nodes get stressed, and operators — those little pieces of code meant to keep order — sometimes behave like stubborn coworkers who refuse to share updates.
That’s where observability becomes critical. You can’t fix what you can’t see — and in the cloud-native world, visibility often means the difference between smooth sailing and chasing down a ghost bug at 3 AM.
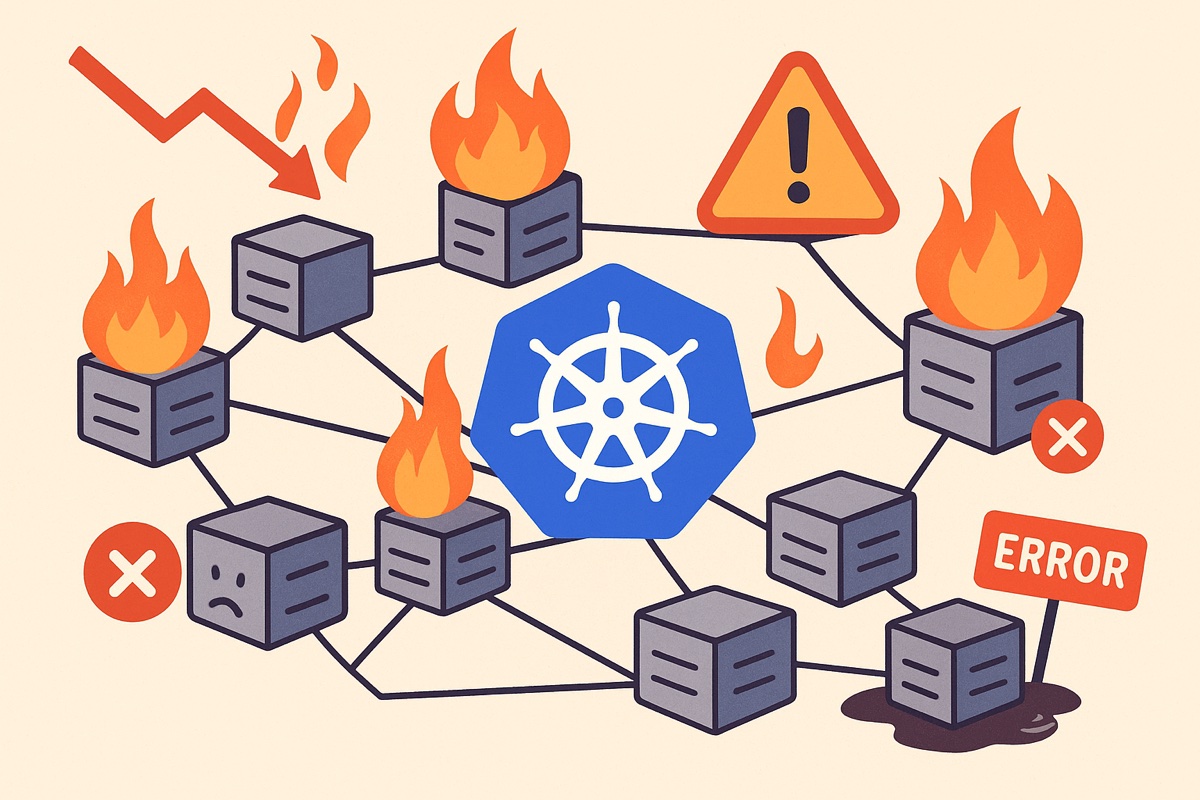
But here’s the pain point:
- Many Kubernetes Operators ship without meaningful observability.
- Adding it often requires bolting on heavy monitoring stacks or hacking together exporters.
- Worse, sometimes you’re forced to bend your operator’s design just to “fit” with a monitoring tool.
It’s also fair to say that my current role as a DevOps Automation Engineer at T-Systems has been a huge source of inspiration.
Day to day, we face the necessity of properly monitoring cluster services, and even built a custom operator to track the values we needed.
At first, I treated this as a playground — a way to learn Golang, experiment with operators, and sharpen my skills.
But over time, a bigger question emerged: what if I could go further and create a universal, plug-and-play monitoring tool?
That simple “what if…” is what eventually evolved into GoWatchtower.
While this is not a corporate project, it definitely carries the DNA of real-world lessons learned on the job.
Special thanks to Dr. Patrick Derck, who has been both a guide and the occasional editor along the way. 🙌
This project started with a simple (and maybe naïve) goal:
👉 Could we add real-time observability to any Operator, with minimal intrusion into the code?
From there, things snowballed — experiment by experiment, repo by repo — until GoWatchtower took shape.
Think of it less like reinventing the wheel, and more like adding a dashboard to a car that was built without one. The engine was already running; you just had no idea how fast, how hot, or how close to breaking down it was.
In the next sections, I’ll walk you through how it all came together: first a local monitoring stack, then a minimal operator, and finally abstracting metrics into a reusable library.
⚠️ Disclaimer: this is still very much a work in progress. Expect rough edges, the occasional gazapo, and plenty of room for improvement. Feedback, corrections, and nitpicks are not just welcome — they’re part of the journey. 🚧
2. The Starting Point: A Local Monitoring Stack 🛠️
Before dreaming about fancy libraries or operator magic, I had to get the basics right.
In Kubernetes, “basics” often means one thing: metrics. You can’t observe what you can’t measure.
So the very first step was setting up a local monitoring stack — nothing exotic, just the usual suspects:
- Prometheus (because metrics are life)
- Grafana (because staring at raw numbers is not fun)
- Kafka (because sometimes you want metrics to travel places)

Why this setup?
Because I needed a playground — a reproducible local environment where I could experiment with streaming pipelines, dashboards, and debugging flows without breaking anything in production.
A few extras made the difference:
- Helm charts for easy reproducibility (spin it up, tear it down, no mess).
- Persistent volumes, so I wouldn’t lose my work every time I restarted Minikube.
- Kafka UI, which saved me from pulling my hair out when debugging what was actually flowing through the topics.
This stack became the foundation layer for everything that followed. Without it, the rest of the journey (operators, libraries, GoWatchtower itself) wouldn’t have had solid ground to stand on.
👉 You can find the repo here: 📡 Monitoring
👉 And the detailed post here: Local Monitoring Stack for Kubernetes (Prometheus + Grafana + Kafka)
3. Building a Minimal Operator ⚙️
Once the monitoring stack was running, I realized I had nothing fun to actually monitor.
That’s when the idea came: why not build a simple operator as a training ground?
The goals were modest (at least at first):
- Learn Golang (spoiler: lots of
panic: nil pointer dereferencealong the way). - Learn Kubebuilder and the basics of writing controllers/CRDs.
- Create something that could generate realistic signals to feed into Prometheus and Grafana.
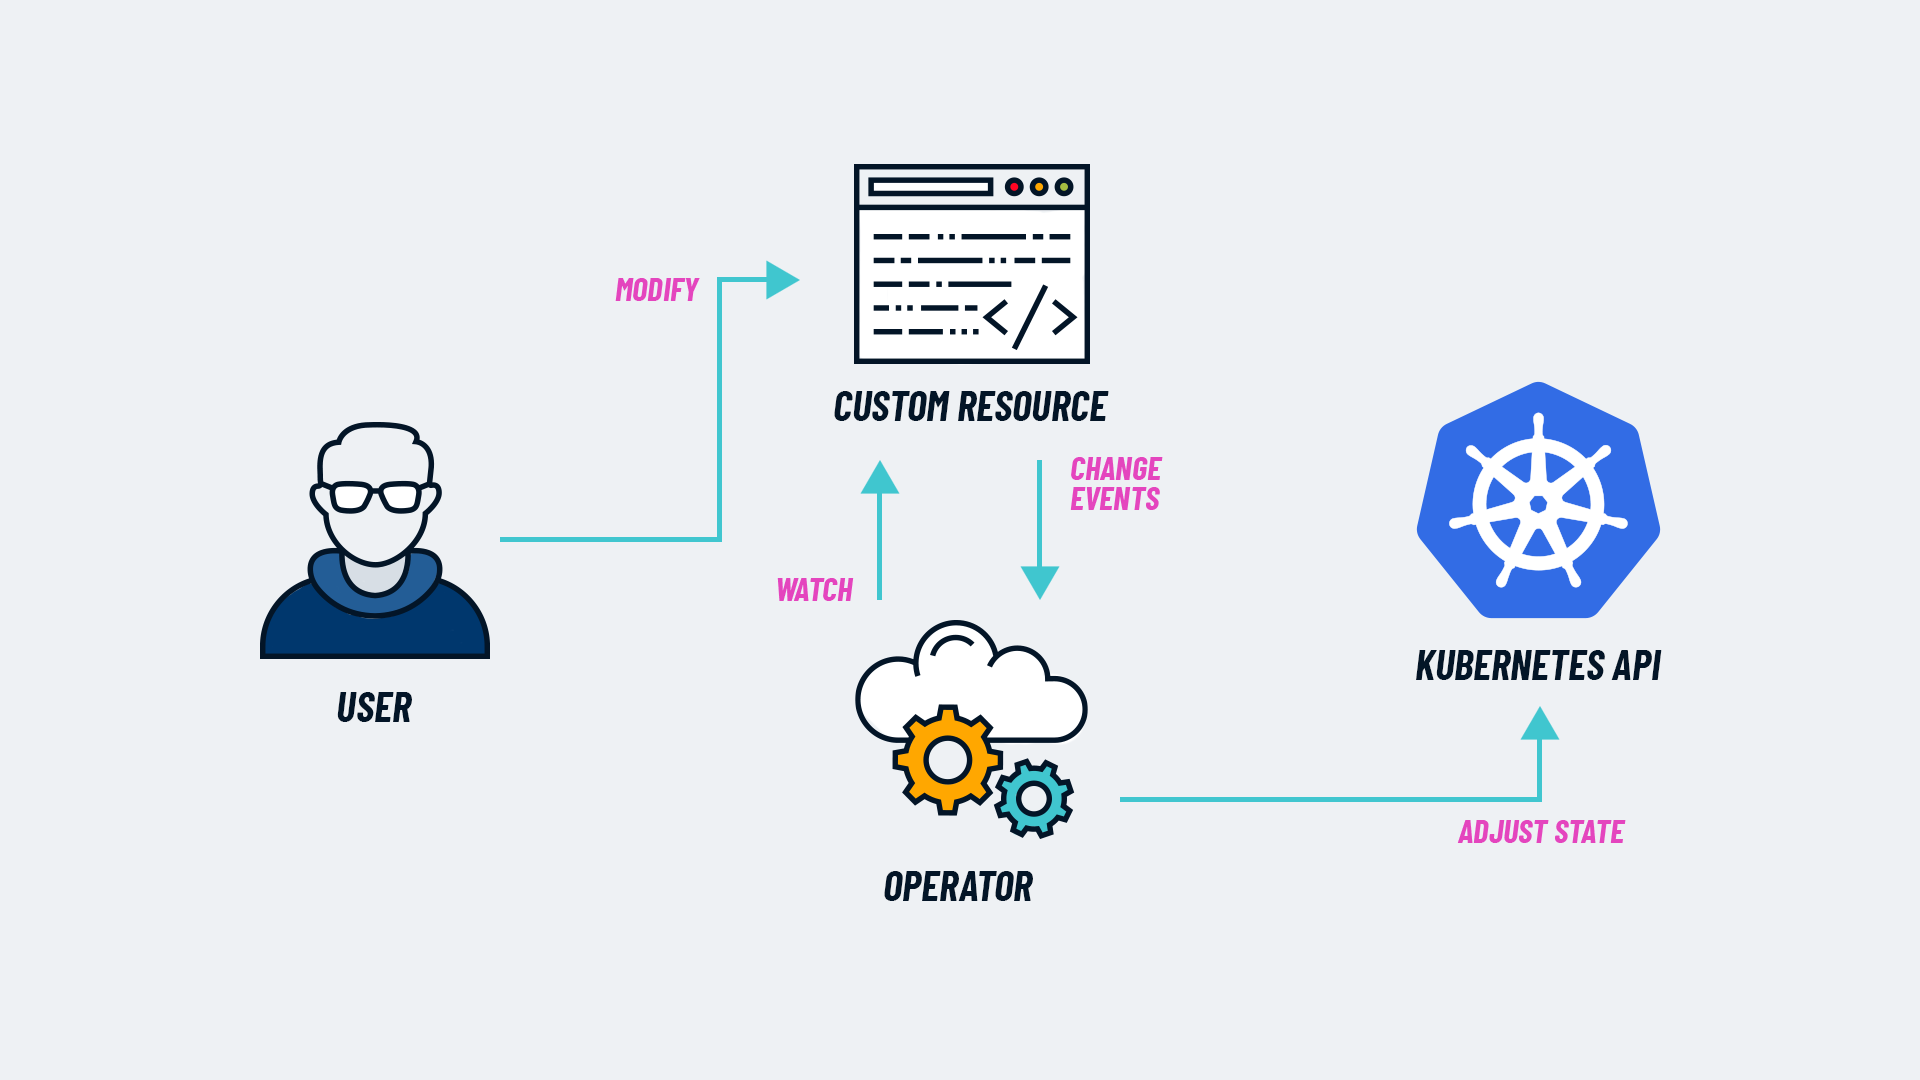
So, the operator came with its own little zoo of test pods:
- 🧮 stress-cpu → max out cores until the laptop fans sounded like a jet engine.
- 💾 memory-load → chew up RAM and watch nodes sweat.
- 🌐 nginx → a simple workload to expose network/service metrics.
Beyond just deploying pods, I extended the operator to export custom metrics:
- Reconcile duration (how long the operator took to react).
- Error count (because yes, I made plenty of them).
- Event tracking (to know when/why something triggered).
This “sandbox operator” was where the lightbulb went on 💡: operators can be way more powerful if they’re observable.
Instead of being black boxes, they can tell you exactly how they’re behaving.
👉 Repo: Simple Operator
👉 Post: Building a Minimal Kubernetes Operator with Custom Metrics Support in Go
4. The Metrics Library: Decoupling Observability from Business Logic 📚

By this point, the Operator was doing its job, pods were screaming under stress tests, and Prometheus/Grafana had something to chew on.
But there was still a problem: all the metrics logic was tangled up inside the operator code.
That’s fine when you’re tinkering… but what if you want to reuse it in another operator?
Or keep your operator’s core logic clean, without sprinkling metric counters and histograms all over the place?
👉 The answer: abstract the observability logic into its own library.
Design principles
- 🔌 Minimal intrusion: Drop it in, configure a few lines, done.
- 📈 Prometheus endpoints: Make metrics available without extra exporters.
- 📡 Kafka producer: Stream metrics outward for advanced use cases (dashboards, alerting, external consumers).
Benefits
- ♻️ Reusability: Any operator can plug it in.
- 🧩 Separation of concerns: Business logic does its job, metrics logic does its own.
- 🚀 Portability: Works in local dev, staging, or production.
Tech stack
- 🐹 Golang (because yes, this was also my way of learning Go properly).
- 📊 Prometheus client (battle-tested, widely adopted).
- ⚡ Kafka producer (for those times when plain dashboards just aren’t enough).
This was the step where the idea of GoWatchtower really started to look like more than a playground project.
It became something I could imagine plugging into any operator — without rewriting the wheel every time.
👉 Repo: Metrics Libs
👉 Post: Golang Library for Operator Metrics: Prometheus + Kafka
5. From Pieces to Vision: GoWatchtower 🏗️
At this stage, all the puzzle pieces were on the table:
- 📡 Monitoring Stack → the infrastructure backbone.
- ⚙️ Simple Operator → the sandbox and testbed.
- 📚 Metrics Library → the reusable engine.
Put them together, and you start to see the bigger picture:
👉 GoWatchtower.
The concept was simple (at least on paper):
- Hook into any Operator with minimal code intrusion.
- Collect metrics not just from pods, but across namespaces.
- Stream them through Kafka for advanced pipelines.
- Visualize in Grafana, without needing a PhD in dashboards.
And because every side project needs a touch of madness:
💡 What if one day we had an install/config UI, and could push alerts straight to Slack… or WhatsApp?
Yes, imagine your phone buzzing at 3AM to let you know your pod is on fire 🔥. Fun, right?
GoWatchtower isn’t just “yet another monitoring tool.”
It’s about creating an observability extension that respects your Operator’s logic, while giving you the visibility you need.
Think of it as the friendly observer in the corner of the room, taking notes but not interrupting the meeting.
6. Roadmap & Next Steps 🛣️
Where does GoWatchtower go from here?
Here’s the plan (subject to caffeine levels ☕):
Short-term (Now → Q4 2025)
- Polish the Metrics Library.
- Write clear docs for integrating it into any operator.
- Publish example dashboards (ready to import into Grafana).
Mid-term (2026)
- Build a GoWatchtower Operator:
- Auto-install Prometheus, Grafana, Kafka.
- Auto-wire dashboards.
- Expand Kafka integrations for external consumers.
Long-term (2027+)
- Add a UI for configuration (easy setup for devs who don’t want to read YAML at 2AM).
- Push alerts to external platforms (Slack, Teams… or yes, even WhatsApp).
- Explore an SDK for other languages (because Go shouldn’t have all the fun).
7. Reflections 💭
Looking back, here are the key lessons:
- 🔍 Observability = Trust. Metrics are useless unless they’re understandable and reliable.
- 🧩 Modularity wins. By splitting infra, operator, and metrics into separate blocks, each piece is useful on its own.
- 🧪 Iterative development works. Starting small (infra → operator → lib → vision) meant validating each step before going further.
- 🚀 GoWatchtower isn’t an end product — it’s the natural outcome of experiments, feedback, and a bit of stubborn curiosity.
If there’s one takeaway, it’s this:
Don’t force people to adapt to your tools. Build tools that adapt to people.
That’s the philosophy behind GoWatchtower — and why I think it could be a small but meaningful contribution to the Kubernetes ecosystem.
✍️ Thanks for reading! GoWatchtower is more than just a library — it’s the story of how a simple learning exercise grew into a personal project, shaped by real-world challenges and a few “what if…” moments. It’s been a journey of experimentation and growth, and who knows where it will lead next.