MLDash: building an observability dashboard for Kubeflow notebooks
For the past months I’ve been working on designing and deploying a full MLOps platform: LLM models in production (code and chat), shared GPUs, Kubeflow, ClearML + agents, all orchestrated by ArgoCD.
That’s material for many articles on its own (they’ll come 👀).
But this story starts in a meeting. A question, out of nowhere:
Is there any way to know who’s using which GPU, how much CPU and memory, across Kubeflow notebooks?
That question stuck with me.

So I started digging on my own to see if something like this already existed. I looked at Kubeflow. I looked at Kubernetes. I looked at Prometheus/Grafana. I found scattered pieces, but nothing that tied together GPU + user + notebook + resources in one place.
If nobody else was going to solve it, and it was the perfect excuse to write some Go over a weekend, why not?
A couple of days later, I had a POC running against a real cluster, with real data — live GPU inventory, active notebooks, users identified.
That’s how mldash was born.
An observability server, not an operator — it only reads cluster state and exposes it. It touches nothing. Minimal permissions, deliberately designed to be non-invasive in a cluster shared across multiple teams.
First design pass
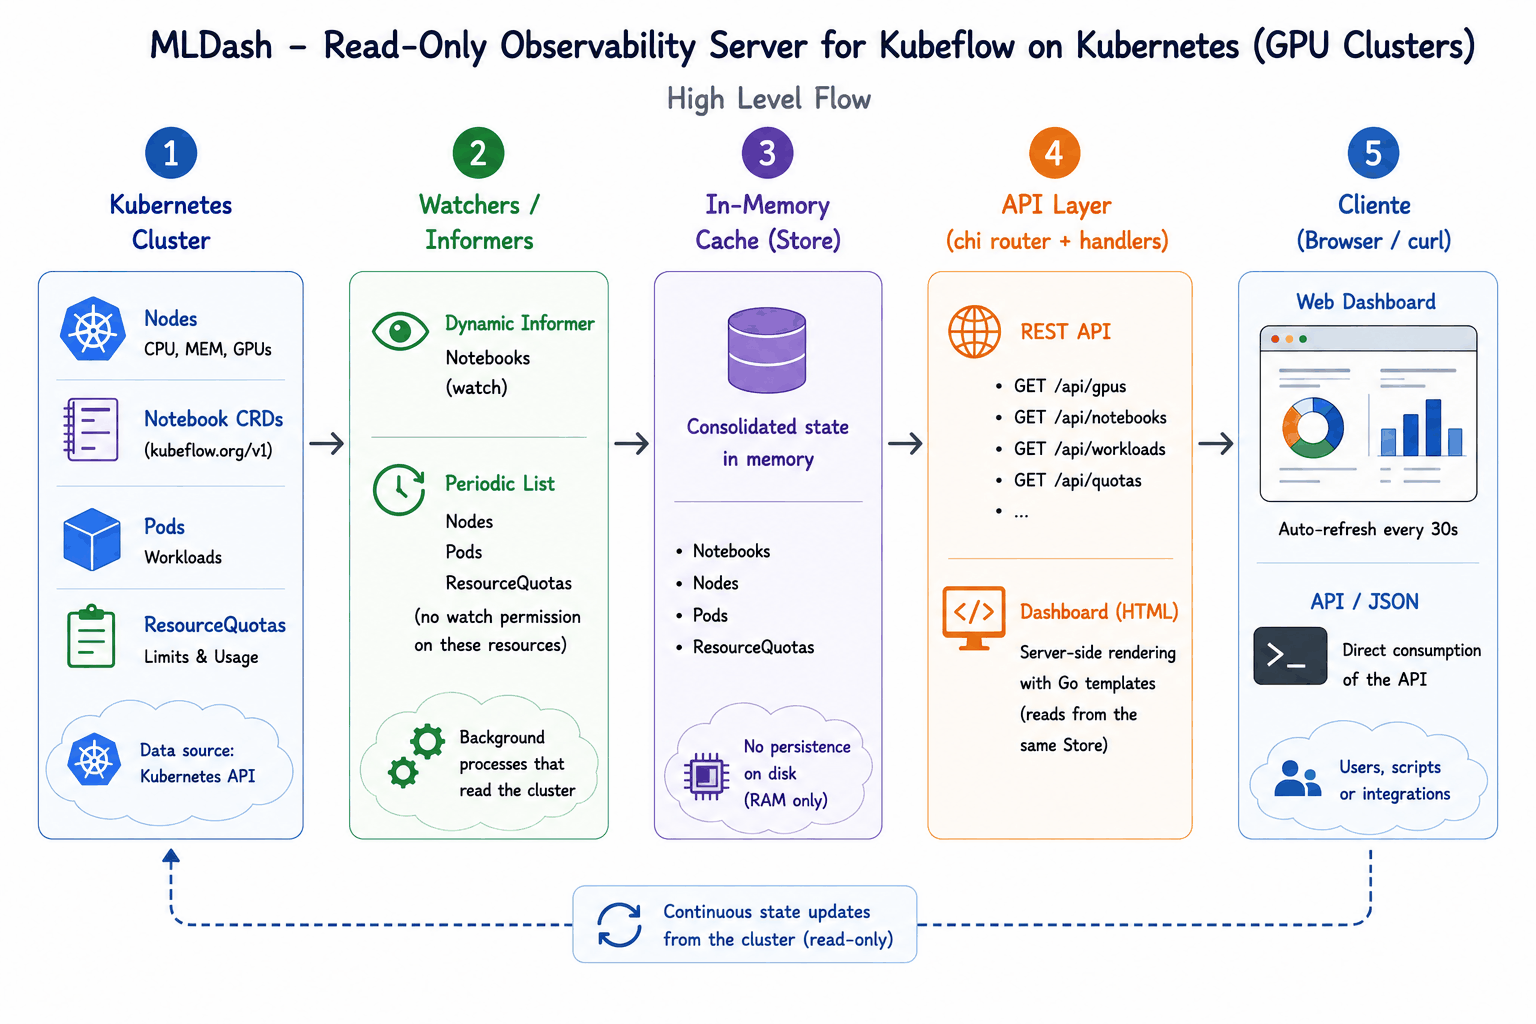
After thinking through the problem, this is the basic architecture that came out of it (I’m sure it’ll change and evolve as it grows):
- A watcher concept: small pieces that keep an eye on specific cluster resources and cache what they find.
- Query each user’s namespace — that’s where Kubeflow notebooks actually live, one namespace per developer.
- Get the total GPU count available in the cluster.
- Cross both: what’s there vs. what’s being used.
Simple starting point. It’s not the final design, but it’s a design I could actually build against.
To get there, I went through several variations of Go’s client-go — the
same API kubectl itself talks to, just embedded directly in my own
binary. Once I confirmed a call worked, I’d refine it. Here’s an early
example: listing nodes and reading how many GPUs the cluster has
allocatable, cluster-wide:
// Connect to the Kubernetes cluster from inside the pod
config, err := rest.InClusterConfig()
if err != nil {
    log.Fatal("not running in cluster")
}
clientset, err := kubernetes.NewForConfig(config)

// List all nodes and sum up their GPU capacity
list, err := clientset.CoreV1().Nodes().List(ctx, metav1.ListOptions{})
for _, node := range list.Items {
    gpuQ := node.Status.Allocatable["nvidia.com/gpu"]
    gpuCount, _ := gpuQ.AsInt64()  // e.g., 8, 4, 2
    // Store in cache...
}
Nothing fancy — just the same information kubectl would show you:
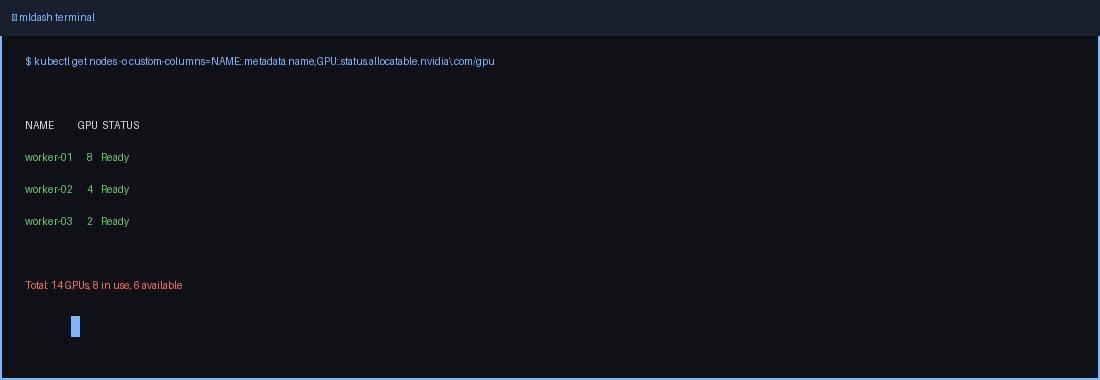
But in Go, structured and cached so the dashboard can use it directly.
It’s still a work in progress — an MVP, not a product. Still missing: a Dockerfile, deployment manifests, code cleanup, and (honestly) getting past my own “not ready to show this yet” stage before opening it up 😅.
Once it clears that bar, the repo goes public.
This is just getting started. I’ll keep sharing the process — design decisions, why Go, how it reads the cluster without ever modifying it, and the bumps along the way.
To be continued.